Geospatial Queries with Python MongoDB
Last Updated :
10 May, 2020
Prerequisites: MongoDB and Python
GeoJSON is an open-source format containing simple geographical features and is based on JavaScript Object Notation. It is used to format shapes in a coordinate space and multiple types are supported by MongoDB to permit storing geospatial data. This article will cover the various ways of using geospatial in MongoDB and explain the GeoJSON polygon and point types.
GeoJSON format
- a field named type that specifies the GeoJSON object type and
- a field named coordinates that specifies the object’s coordinates.
Note: If specifying latitude and longitude coordinates, list the longitude first and then latitude.
Modules Needed:
Steps to use MongoDB Atlas:
- Open the MongoDB Atlas Cloud from here.
- Create the account by choosing the package suitable for you (You may also choose the free version which will be enough for this article and for learning purpose).
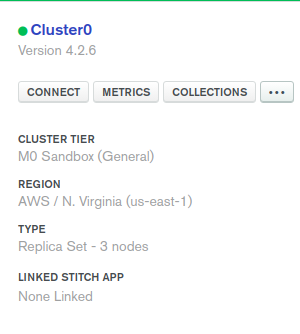
- Click on the Cluster view positioned at the left menu bar.
- Click on the Ellipses button
(...) and select Load Sample Dataset.
- After the sample dataset is added then click on the connect button.
- Then whitelist the IP address (choose your current IP address or type the 0.0.0.0/0 IP for allowing it to access from everywhere. Click the button shown in the below image.

- Then click connect to applications button.
- Copy the cluster_uri and paste it to a “course_cluster_uri”.
Below is the implementation.
import pymongo
import pprint
import matplotlib.pyplot as plt
from mpl_toolkits.basemap import Basemap
course_cluster_uri = 'your_connection_string'
course_client = pymongo.MongoClient(course_cluster_uri)
db = course_client['sample_geospatial']
shipwrecks = db['shipwrecks']
l = list(shipwrecks.find({}))
lngs = [x['londec'] for x in l]
lats = [x['latdec'] for x in l]
plt.clf()
plt.figure(figsize =(14, 8))
m = Basemap(lat_0 = lats[0],
lon_0 = lngs[0],
projection ='cyl')
m.drawcoastlines()
m.drawstates()
x, y = m(lngs, lats)
plt.scatter(x, y)
plt.show()
|
Output:
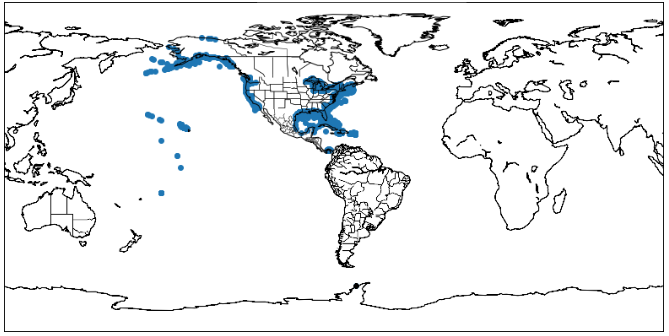
shipwrecks plot
Like Article
Suggest improvement
Share your thoughts in the comments
Please Login to comment...