Generate Word Clouds Of Any Shape In Python
Last Updated :
10 Dec, 2021
In this article, we will discuss how to create word clouds of any shape in Python.
The term WordCloud refers to a data visualization technique for showing text data in which the size of each word indicates its frequency or relevance. To create a word cloud of any shape, use Python’s Matplotlib, word cloud, NumPy, and PIL packages.
Stepwise Implementation
Let’s have a look at the step-by-step implementation –
Step 1: Install the following modules as listed below-
pip install matplotlib
pip install wordcloud
Step 2: Import the following modules as listed below-
import matplotlib.pyplot as plt
from wordcloud import WordCloud, STOPWORDS
import numpy as np
from PIL import Image
Step 3: Follow the steps below-
- Give the full path to the text file you intend to use.
- In read mode, open the text file.
- Finally, encode and read it.
- In this article following text file will be used- Text
text = open(r'C:\Users\Dell\Desktop\Wordcloud\Text.txt',
            mode='r', encoding='utf-8').read()
Step 4: Follow the steps below-
- Give the entire image path that we will use to get our output in the same shape.
- Then, using the image.open function, open the image.
- After that, use NumPy to create the image’s array.
- The below image will be used in this article for the desired shape

mask = np.array(Image.open(r'C:\Users\Dell|Downloads\Garbage\GFG.png'))
Step 5: Create a wordcloud by integrating a stopword, a mask, a background color, the maximum number of words in the wordcloud, the height of the mask, and the width of the mask.
- stopwords- It is used to avoid unnecessary characters such as ‘./-[{)*&^%~@!#%^&].
- mask- Mask is the shape to which we will convert our wordcloud.
- background_color- We can use whatever background color we like, such as black, green, and so on.
- max_words- It is the maximum number of words that a wordcloud can contain.
- max_font- It’s maximum font size.
- The width and height of the wordcloud are represented by Width and Height.
wc = WordCloud(stopwords = STOPWORDS,
               mask = mask, background_color = "white",
               max_words = 2000, max_font_size = 500,
               random_state = 42, width = mask.shape[1],
               height = mask.shape[0])
Step 6:
- Now, using the generate function, we will create a wordcloud from the provided text.
- To display image data, use the imshow function.
- We will try to off the x and y-axis.
- Finally, we will display the generated wordcloud using the show function defined within matplotlib.
wc.generate(text)
plt.imshow(wc, interpolation="None")
plt.axis('off')
plt.show()
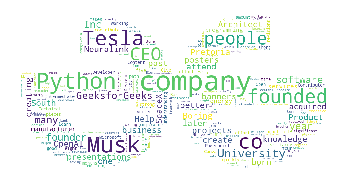
Below is the complete implementation.
Python3
import matplotlib.pyplot as plt
from wordcloud import WordCloud, STOPWORDS
import numpy as np
from PIL import Image
text = open(r'C:\Users\Dell\Desktop\Wordcloud\Text.txt',
mode = 'r', encoding = 'utf-8').read()
mask = np.array(Image.open(
r'C:\Users\Dell\Downloads\Garbage\GFG.png'))
wc = WordCloud(stopwords = STOPWORDS,
mask = mask,
background_color = "white",
max_words = 2000,
max_font_size = 500,
random_state = 42,
width = mask.shape[1],
height = mask.shape[0])
wc.generate(text)
plt.imshow(wc, interpolation = "None")
plt.axis('off')
plt.show()
|
Output:
Change Font Size
Follow the steps below to change the font size of the words in the word cloud-
- First, select a font from this collection.
- Download the font file—you see that it is in .zip format.
- Open the zip file and extract the TTF or otf file from it.
- Now just provide the full path of the TTF or otf file.
path = r'C:\Users\Dell\Downloads\Garbage\Candy Beans.otf'
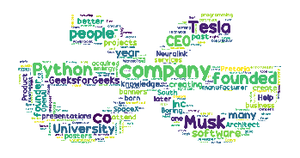
Complete Code:
Python3
import matplotlib.pyplot as plt
from wordcloud import WordCloud, STOPWORDS
import numpy as np
from PIL import Image
text = open(r'C:\Users\Dell\Desktop\Wordcloud\Text.txt',
mode = 'r', encoding = 'utf-8').read()
path = r'C:\Users\Dell\Downloads\Garbage\Candy Beans.otf'
mask = np.array(Image.open(
r'C:\Users\Dell\Downloads\Garbage\GFG.png'))
wc = WordCloud(stopwords = STOPWORDS,
font_path = path,
mask = mask,
background_color = "white",
max_words = 2000,
max_font_size = 500,
random_state = 42,
width = mask.shape[1],
height = mask.shape[0])
wc.generate(text)
plt.imshow(wc, interpolation = "None")
plt.axis('off')
plt.show()
|
Output:
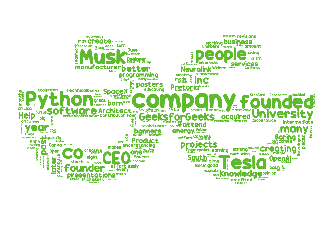
Change the Font Color
Follow the steps below to change the font color of the text in a word cloud-
- Create a function to change the font color.
- Because the HSL of each color is unique, just pass the HSL and return it.
Complete Code:
Python3
import matplotlib.pyplot as plt
from wordcloud import WordCloud, STOPWORDS
import numpy as np
from PIL import Image
def one_color_func(word = None, font_size = None,
position = None, orientation = None,
font_path = None, random_state = None):
h = 99
s = 62
l = 45
return "hsl({}, {}%, {}%)".format(h, s, l)
text = open(r'C:\Users\Dell\Desktop\Text.txt',
mode = 'r', encoding = 'utf-8').read()
path = r'C:\Users\Dell\Downloads\Garbage\Candy Beans.otf'
mask = np.array(Image.open(
r'C:\Users\Dell\Downloads\Garbage\GFG!.png'))
wc = WordCloud(stopwords = STOPWORDS,
font_path = path,
mask = mask,
background_color = "white",
max_words = 2000,
max_font_size = 500,
random_state = 42,
width = mask.shape[1],
height = mask.shape[0],
color_func = one_color_func)
wc.generate(text)
plt.imshow(wc, interpolation = "None")
plt.axis('off')
plt.show()
|
Output:
Like Article
Suggest improvement
Share your thoughts in the comments
Please Login to comment...