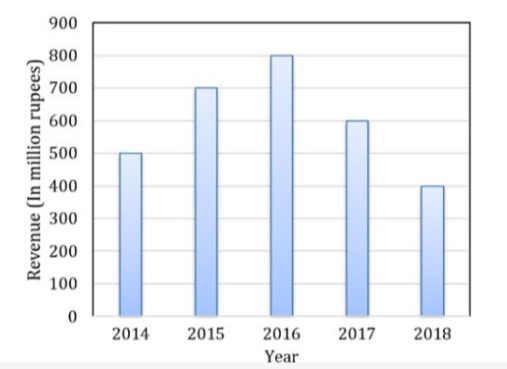
The total revenue of a company during 2014−2018 is shown in the bar graph. If the total expenditure of the company in each year is 500 million rupees, then the aggregate profit or loss (in percentage) on the total expenditure of the company during 2014−2018 is _________ .
(A) 16.67% profit
(B) 16.67% loss
(C) 20% profit
(D) 20% loss
Answer: (C)
Explanation: Bar-graph: 2014-2018,
Total expenditure,
= 500 million/year
= 500 × 5
= 2500 million
Now, Revenue total (from the graph),
= 400 + 500 + 600 + 700 + 800
= 3000 million
Therefore, Profit,
= 3000 - 2500 = 500
Profit (in percentage),
= (500/2500)*100 %
= 20 % profit
Option (C) is correct.
Quiz of this Question
Like Article
Suggest improvement
Share your thoughts in the comments
Please Login to comment...