Gantt Chart in Tableau
Last Updated :
22 Oct, 2020
In this article, we will learn how to illustrate a Gantt Chart in Tableau.
- Tableau: Tableau is a very powerful data visualization tool that can be used by data analysts, scientists, statisticians, etc. to visualize the data and get a clear opinion based on the data analysis. Tableau is very famous as it can take in data and produce the required data visualization output in a very short time.
- Gantt Chart: A Gantt chart, commonly utilized in project management, is one among the foremost popular and useful ways of showing activities (tasks or events) displayed against the clock. On the left of the chart may be a list of the activities and along the highest may be a suitable duration. Each activity is represented by a bar; the position and length of the bar reflects the beginning date, duration and end date of the activity.
Dataset used in the given examples is Dataset.
Steps to illustrate a Gantt Chart in Tableau:
1. Open Tableau tool and connect a dataset into it.
2. Drag and drop the one sheet of connected dataset.
3. Click on Sheet1 to open the tableau worksheet.
4. On clicking Sheet1 you will get whole dataset attributes on left side and a worksheet for work.
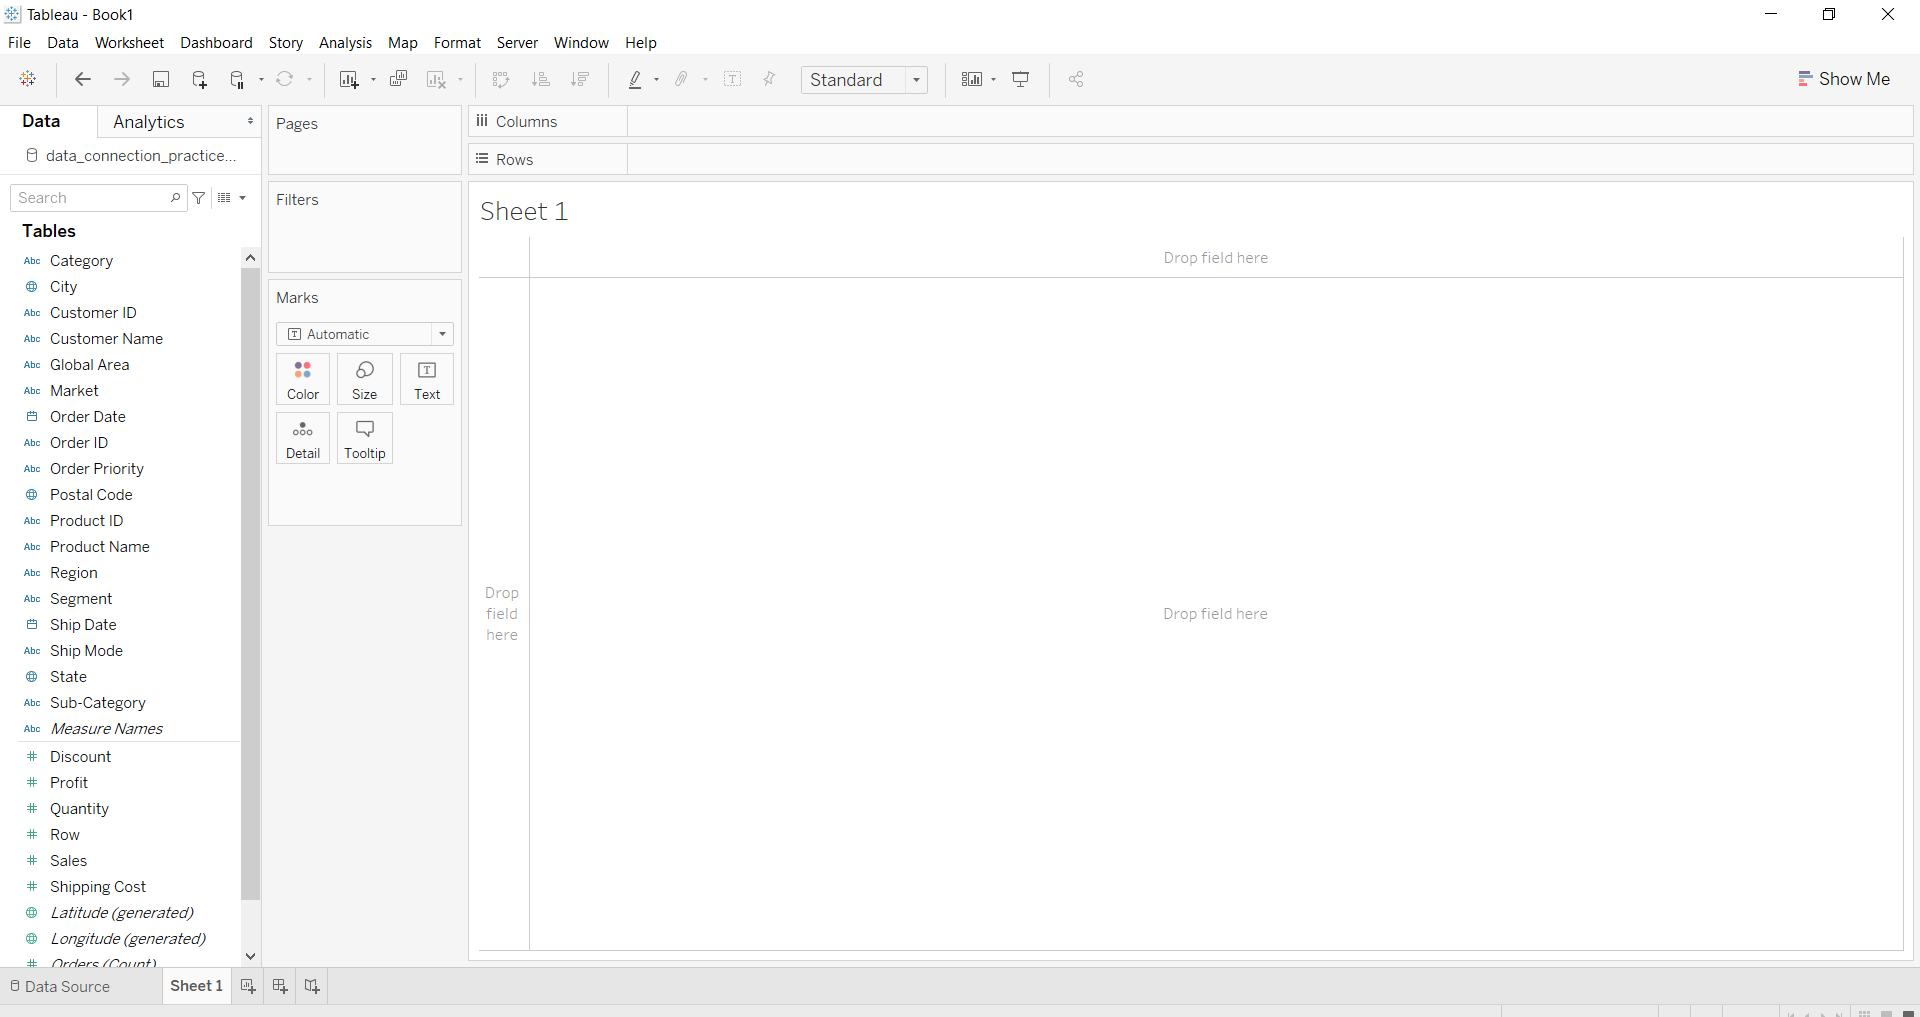
5. To draw a Gantt chart you have to select minimum two attributes (one date attribute and one dimensions attribute) by drag and drop then select the chart option as Gantt.
Example 1:
This example will help you to draw a simple Gantt Chart.
Example 2:
Below example is also drawn similar to the above example with some extra features of color and hierarchy.

Example 3:
This example is also drawn similar to above example 1 but drawn with different values and different features for better understandings.
Like Article
Suggest improvement
Share your thoughts in the comments
Please Login to comment...