DevTools is a tooling suite for Flutter and Dart developers consisting of layout inspection tools, performance tools, memory tools basically all the debugging tools that you need to be an efficient and effective Flutter developer bundled into a single web suite.
Usage of DevTools:
The Flutter DevTools can be used to perform a number of operations. Some of them are listed below:
- UI inspection.
- App state inspection.
- Diagnose UI junk performance.
- Diagnose issues with flutter apps.
- DevTools use for CPU profiling.
- Network profiling for an app.
- Source-level debugging of an app.
- Debug memory issues in a Flutter or Dart or command-line app.
- View general log and diagnostics information of an app.
- Analyze your code and app size of the flutter app.
Installing DevTools:
1. Install Flutter DevTool in Android Studio
Follow the below steps to install DevTools in your Android Studio:
- Step 1: Install the Flutter plugin in Android Studio, if you don’t already have it installed. This can be done using the normal Plugins page in the Android Studio settings. Once settings->plug-ins page is open, you can search flutter in the marketplace and install the plugin.
- Step 2: You first run a Flutter app. Ensuring that you have a device connected to the project, and clicking the Run or Debug toolbar buttons.
- Step 3: Launch DevTools from the toolbar/menu in your flutter project. Once an app is running successfully, start DevTools implementing the following instruction one by one:
- Open DevTools toolbar action from Run view.
- DevTools toolbar action visible in the Debug view. (if debugging)
- DevTools action from the More Actions menu in Inspector view in your flutter project.
2. Installing DevTools from VS Code
Follow the below steps to install DevTools from VS Code:
- Step 1: To use the DevTools from VS Code firstly install the Dart extension also you need to install the Flutter extension for debugging flutter applications.
- Step 2: Launch an application to debug your application. Start debugging in VS Code by clicking Run > Start Debugging (F5).
- Step 3: If once debugging started, the Dart Opens DevTools command becomes available in the VS Code command palette:

Screenshot showing Open DevTools command:

When you run your app the first time, you will be prompted to activate or upgrade DevTools. The below image shows an Active DevTools command:
Clicking the Open button to activate the DevTools package for your application. After this, DevTools launches in your browser and automatically connects to your debug session as shown below:

When DevTools is in an active state, you’ll see them in the status bar of VS Code.
3. Install DevTools from the command line
If you have flutter on your computer, you can run:
flutter pub global activate devtools
The above command installs or updates DevTools on your machine or computer. Launch the DevTools from the application server. Run the local webserver. To do that runs the following commands:
flutter pub global run devtools
On the command line, the output looks something like this:
Serving DevTools at http://127.0.0.1:9100
Start an application to debug:
Start a Flutter application or a Dart command-line application. The command for flutter app:
cd path/to/flutter/app
flutter run
You need to have a device connected for the flutter run to work. After the app starts, Following message in your terminal:
An Observatory debugger and profiler on Galaxys20 is available
at: http://127.0.0.1:50976/Swm0bjIe0hj=/
Note that this URL, we will use to connect our app to DevTools.
Connect DevTools to target app:
Once All things set up, debugging through DevTools is very simple as opening a Chrome browser window and navigating to the below link:
http://localhost:9100
After DevTools opens, the dialog box pop-up you will get the below Logging view:

Paste the URL, which you already note from running your app (example, http://127.0.0.1:50976/Swm0bjIe0hg=/) into the connect dialog to connect your app to DevTools to debugging.
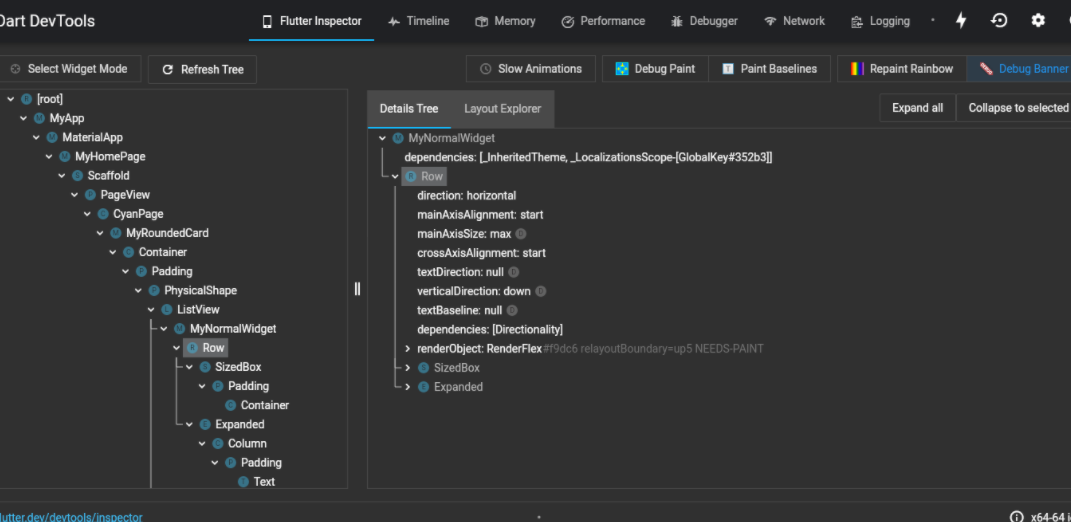
The Flutter inspector:
The Flutter widget inspector is a great tool for visualizing and monitoring the Flutter widget trees of your application. The Flutter framework uses widgets as the core building block for control anything (such as text, buttons, etc.), to layout (such as centering, padding, row, and column. Inspector helps to visualize and explore widget trees, and can be used for the following:
- With the help of the inspector, you can easily understand the existing layouts of your app.
- Diagnosing layout issues in your application if anyone arises.
Debugging layout issues visually
The following is an instruction to the features available in the inspector’s toolbar in flutter’s DevTools:
- Select widget mode: Select a widget and click on the button on the device to inspect it.
- Refresh tree: This button used to reload the current widget info.
- Slow Animations: It is used to slow down animations to enable visual inspection.
- Debug Paint: Debug Paint button used to add visual debugging, Which hints to the rendering that displays borders, padding, alignment, and spacers, etc.
- Paint Baselines: Use of each RenderBox to paint a line at each of its text baselines in the project.
- Repaint Rainbow: Repaint Rainbow allows rotating colors on layers when repainting.
- Debug Mode Banner: It is used to display the debug banner even when running a debug build.
Inspecting a widget:
Flutter Layout Explorer
The Flutter Layout Explorer allows you to better understand Flutter layouts. It supports the only exploration of flex layouts but it is possible that it will be extended in the future. To use the Layout Explorer, select the following tab to display the Layout Explorer feature.

The Layout Explorer visualizes how to Flex widgets and their children. The explorer identifies the main axis and cross axis and the current alignment in your application when you debugging it. Also, explorer shows layout constraint violations and render overflow errors in your app. During debugging sessions violated layout constraints are colored red, and overflow errors are presented in the standard “yellow-tape” pattern, as you might see on a running device in your emulator. All the above and following visualizations aim to understand easily, why overflow errors occur as well as how to fix them.

The Timeline view:
The timeline view provides us, timing, and performance information for the currently debugging applications. It contains three-part, each part increasing in granularity.
- Flutter frames chart.
- Timeline events chart.
- CPU profiler.
Also, the timeline view supports importing and exporting of timeline data files.
Flutter frames chart:
This frame chart contains Flutter’s frame information for your application. Every single bar in the chart represents a single Flutter frame. The bars, which are color-coded to highlight the different portions of work that occur when rendering a Flutter frame as shown below:

Selecting a bar from the above chart centers the flame chart below on the timeline events corresponding to the selected Flutter frame which is colored blue in the chart as shown below:

The User Interface:
The UI executes Dart code in the Dart VM. It includes code from your application and Flutter framework. When you create an app and display a scene, this thread creates a layer tree, device-agnostic painting commands, and sends the layer tree to the raster thread which will be rendered on the device.
The Raster:
The raster thread (called GPU thread), executes graphics code from Flutter Engine. This thread takes the layer tree and displays it with the help of the GPU. It cannot directly access the raster thread or its data.
The Jank:
Whenever a frame becomes janky, the jank frame visible with a red overlay. A frame is janky when it takes more than ~16 ms to complete (for 60 FPS devices) whenever this target is missed UI dropped frames. Achieving frame rendering rate of 60 FPS, every frame must render in ~16 ms or less.
The Timeline events chart:
The timeline events chart displays all event trace from the application. The Flutter framework shows timeline events as it works to build frames, draw scenes, and track other activities. All events show up here in the Timeline.

The Flame chart:
The Flame chart shows CPU samples for the selected frame event (such as Layout etc.). This profiler should be viewed as a top-down stack trace, where the top-most stack frame calls the one below it, and the width of each stack frame represents the amount of time it consumed the CPU during the inspection or debugging as shown below:

The Call tree:
The call tree displays the method trace for the CPU profile. This table of call tree is a top-down representation of the profile which means that a method can be expanded to describe its callees.
- Total time: Time the method spent executing the code with its callees.
- Self time: Time the method spent to executing its own code.
- Method: Name or identity of the called method.
- Source: File path for the method call site in your machine.
An image of the same is shown below:

The Bottom-up:
The bottom-up view displays the method trace for the CPU profile but, accordingly to name, it is a bottom-up representation of the profile. This means that every top-level method in the table is actually the last method in the call stack for a given CPU sample.

The Memory view:
The allocated object in any application created using a class constructor (like using new MyClass() or MyClass()) live in a portion of memory known as the heap. Memory page in DevTools lets you peek at how an isolate is using memory at a given time. With the help of Monitor Allocations and Reset options, anyone can analyze accumulator counts. The accumulators can be used to study the rate of memory allocations for any dart app, if you suspect your application is leaking memory or has other bugs relating to memory allocation you can easily figure out it on the memory page. Memory profiling contains six parts:
- Chart of Memory overview
- Chart for Android-only memory
- Event timeline
- Monitoring and setting up of Dart total instances, size, and accumulator monitoring to detect memory leaks in applications
- Snapshots of all live memory class instances, sentinels, etc.
A time-series graph is used to visualize the state of the Flutter memory at successive intervals of time over your application. Every data point on the chart corresponds to the time stamp (x-axis) of measured quantities and (y-axis) of the heap. Example, usage, capacity, external, garbage collection, resident set size, and many more.

The Performance view:
The performance view provides us feature to record and profile a session from your Dart or Flutter application. If you are running a Flutter application, please build a profile build to analyze the performance of your application.
The Network View:
The network view allows you for inspecting web socket traffic like HTTP and HTTPS from your Dart or Flutter application. Screenshot of the network screen:

Some examples of filter queries:
my-endpoint m:get t:json s:200
https s:404
The Debugger:
DevTools contains a fully originated source-level debugger which is supporting breakpoints, stepping, and variable inspection. When anyone opens their debugger tab, they should see the source for the main entry-point for your app loaded in the debugger. For browsing around more of your application sources, click Libraries (top right) or use an alternate method the hotkey command ⌘ + P / ctrl + P. This will open the libraries window and allow you to search for other source files from your application.

In addition, the Resume button continues regular execution of the application in which you worked on.
Concept of App size tool:
The app size tool frees you to analyze the total size of your app and can view a single snapshot of “size information” using the Analysis tab, or compare two different snapshots of “size information”, which contains size data for Dart code of your application. The flutter compiler attempts to optimize your app’s size by removing pieces of code that are unused or unreachable(garbage code) in your application.
Analysis tab:
In the analysis tab you can view the hierarchical structure of the size data using the treemap and table, view code attribution data (i.e. why a piece of code is included in your compiled application) using the dominator tree and call graph.

Loading a size file:
Whenever you open the Analysis tab, instructions to load an app size file. Drag and drop an app size file into the dialogbox and click to button “Analyze Size”.

Diff tab:
The diff tab provides us to compare two snapshots of size information, two size information files you are comparing should be generated from two different versions of the same app, for example, the size file generated before and after changes to your application code can visualize the difference between the two data sets using the tree-map and table.

Like Article
Suggest improvement
Share your thoughts in the comments
Please Login to comment...