Finding the Quantile and Decile Ranks of a Pandas DataFrame column
Last Updated :
20 Dec, 2021
A Quantile is where a sample is divided into equal-sized, adjacent, subgroups.
The median is a quantile; the median is placed in a probability distribution so that exactly half of the data is lower than the median and half of the data is above the median. The median cuts a distribution into two equal areas and so it is sometimes called 2-quantile.
Quartiles are also quantiles; they divide the distribution into four equal parts.
Percentiles are quantiles that divide a distribution into 100 equal parts and deciles are quantiles that divide a distribution into 10 equal parts.
We can use the following formula to estimate the ith observation:
ith observation = q (n + 1)
where q is the quantile, the proportion below the ith value that you are looking for
n is the number of items in a data set.
So for finding Quantile rank, q should be 0.25 as we want to divide our data set into 4 equal parts and rank the values from 0-3 based on which quartile they fall upon.
And similarly for Decile rank, q should be 0.1 as we want our data set to be divided into 10 equal parts.
Before moving to Pandas, lets us try the above concept on an example to understand how our Quantile and Decile Ranks are calculated.
Sample question : Find the number in the following set of data where 25 percent of values fall below it, and 75 percent fall above.
Data : 32, 47, 55, 62, 74, 77, 86
Step 1: Order the data from smallest to largest. The data in the question is already in ascending order.
Step 2: Count how many observations you have in your data set. this particular data set has 7 items.
Step 3: Convert any percentage to a decimal for “q”. We are looking for the number where 25 percent of the values fall below it, so convert that to .25.
Step 4: Insert your values into the formula:
Answer:
ith observation = q (n + 1)
ith observation = .25(7 + 1) = 2
The ith observation is at 2. The 2nd number in the set is 47, which is the number where 25 percent of the values fall below it. And then we can start ranking our numbers from 0-3 since we are finding Quantile Rank. Similar approach for finding Decile Rank, in this case its just that the value of q will be 0.1.
Now let us now look in Pandas how we can quickly achieve the same.
Code for Creating a DataFrame:
python3
import pandas as pd
df1 = {'Name':['George', 'Andrea', 'John', 'Helen',
'Ravi', 'Julia', 'Justin'],
'EnglishScore':[62, 47, 55, 74, 32, 77, 86]}
df1 = pd.DataFrame(df1, columns = ['Name', ''])
df1.sort_values(by =['EnglishScore'], inplace = True)
|
If we print the above dataframe we get the below result :
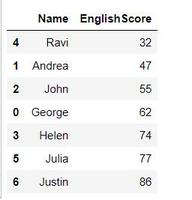
Data Frame
Now we can find the Quantile Rank using the pandas function qcut() by passing the column name which is to be considered for the Rank, the value for parameter q which signifies the Number of quantiles. 10 for deciles, 4 for quartiles, etc. and labels = False to return the bins as Integers.
Following is code for Quantile Rank
python3
df1['QuantileRank']= pd.qcut(df1['EnglishScore'],
q = 4, labels = False)
|
And now if we print the dataframe we can see the new column QauntileRank ranking our data based on EnglishScore column.
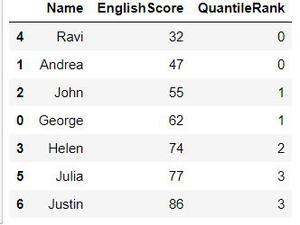
Quantile Rank
Similarly to calculate Decile Rank we set q = 10
python3
df1['DecileRank']= pd.qcut(df1['EnglishScore'],
q = 10, labels = False)
|
Now if we print our DataFrame we get the following output.
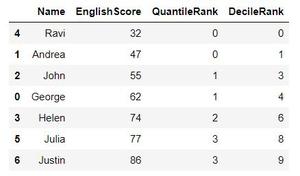
DecileRank
That is how we can use the Pandas qcut() method to calculate the various Quantiles on a column.
The entire code for the above example is given below.
python3
import pandas as pd
df1 = {'Name':['George', 'Andrea', 'John', 'Helen',
'Ravi', 'Julia', 'Justin'],
'EnglishScore':[62, 47, 55, 74, 32, 77, 86]}
df1 = pd.DataFrame(df1, columns =['Name', 'EnglishScore'])
df1.sort_values(by =['EnglishScore'], inplace = True)
df1['QuantileRank']= pd.qcut(df1['EnglishScore'], q = 4, labels = False)
df1['DecileRank'] = pd.qcut(df1['EnglishScore'], q = 10, labels = False)
print(df1)
|
Like Article
Suggest improvement
Share your thoughts in the comments
Please Login to comment...