Find the unique rows in R DataFrame
Last Updated :
07 Apr, 2021
In an R data frame, a unique row means that none of the elements in that row are replicated in the whole data frame with the same combination. In simple terms, if we have a data frame called df with four columns and five rows, we can assume that none of the values in one row are replicated in every other row.
If we have many redundant rows in our data collection, we can need to look for certain types of rows. We can use the dplyr package’s group_by_all function to achieve this. It will group all the redundant rows and return unique rows with their count.
Example 1:
R
library("dplyr")
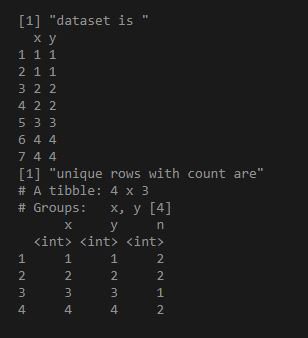
df = data.frame(x = as.integer(c(1, 1, 2, 2, 3, 4, 4)),
y = as.integer(c(1, 1, 2, 2, 3, 4, 4)))
print("dataset is ")
print(df)
ans = df%>%group_by_all%>%count
print("unique rows with count are")
print(ans)
|
Output:
Example 2:
R
library("dplyr")
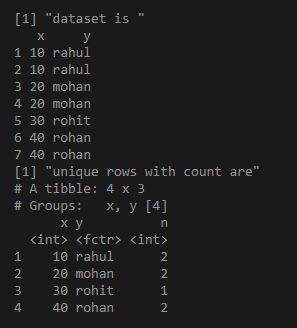
df = data.frame(x = as.integer( c(10,10,20,20,30,40,40) ),
y = c("rahul", "rahul", "mohan","mohan", "rohit", "rohan", "rohan"))
print("dataset is ")
print(df)
ans = df%>%group_by_all%>%count
print("unique rows with count are")
print(ans)
|
Output:
Like Article
Suggest improvement
Share your thoughts in the comments
Please Login to comment...