Filtering in Visualization in Tableau
Last Updated :
01 Oct, 2020
In this article, we will learn how to do Filtering in Visualization in tableau worksheet to do further operations. For this first look into three terms :
- Tableau: Tableau software is one of the fastest-growing data visualization tools which is currently getting used within the BI industry. It is the simplest thanks to change or transform the raw set of knowledge into an easily understandable format with zero technical skills and coding knowledge.
- Filtering: Filter a visualization to limit and customize the data displayed on visualization in a dashboard. For example, you can filter the visualization to display only selected geographical regions, the top five most-profitable regions, or those regions with more than $1 million in revenue.
- Visualization: Data Visualization is the presentation of data in graphical format. It helps people understand the significance of data by summarizing and presenting huge amount of data in a simple and easy-to-understand format and helps communicate information clearly and effectively.
Dataset used in the given examples is Dataset.
For this we have to follow some steps :
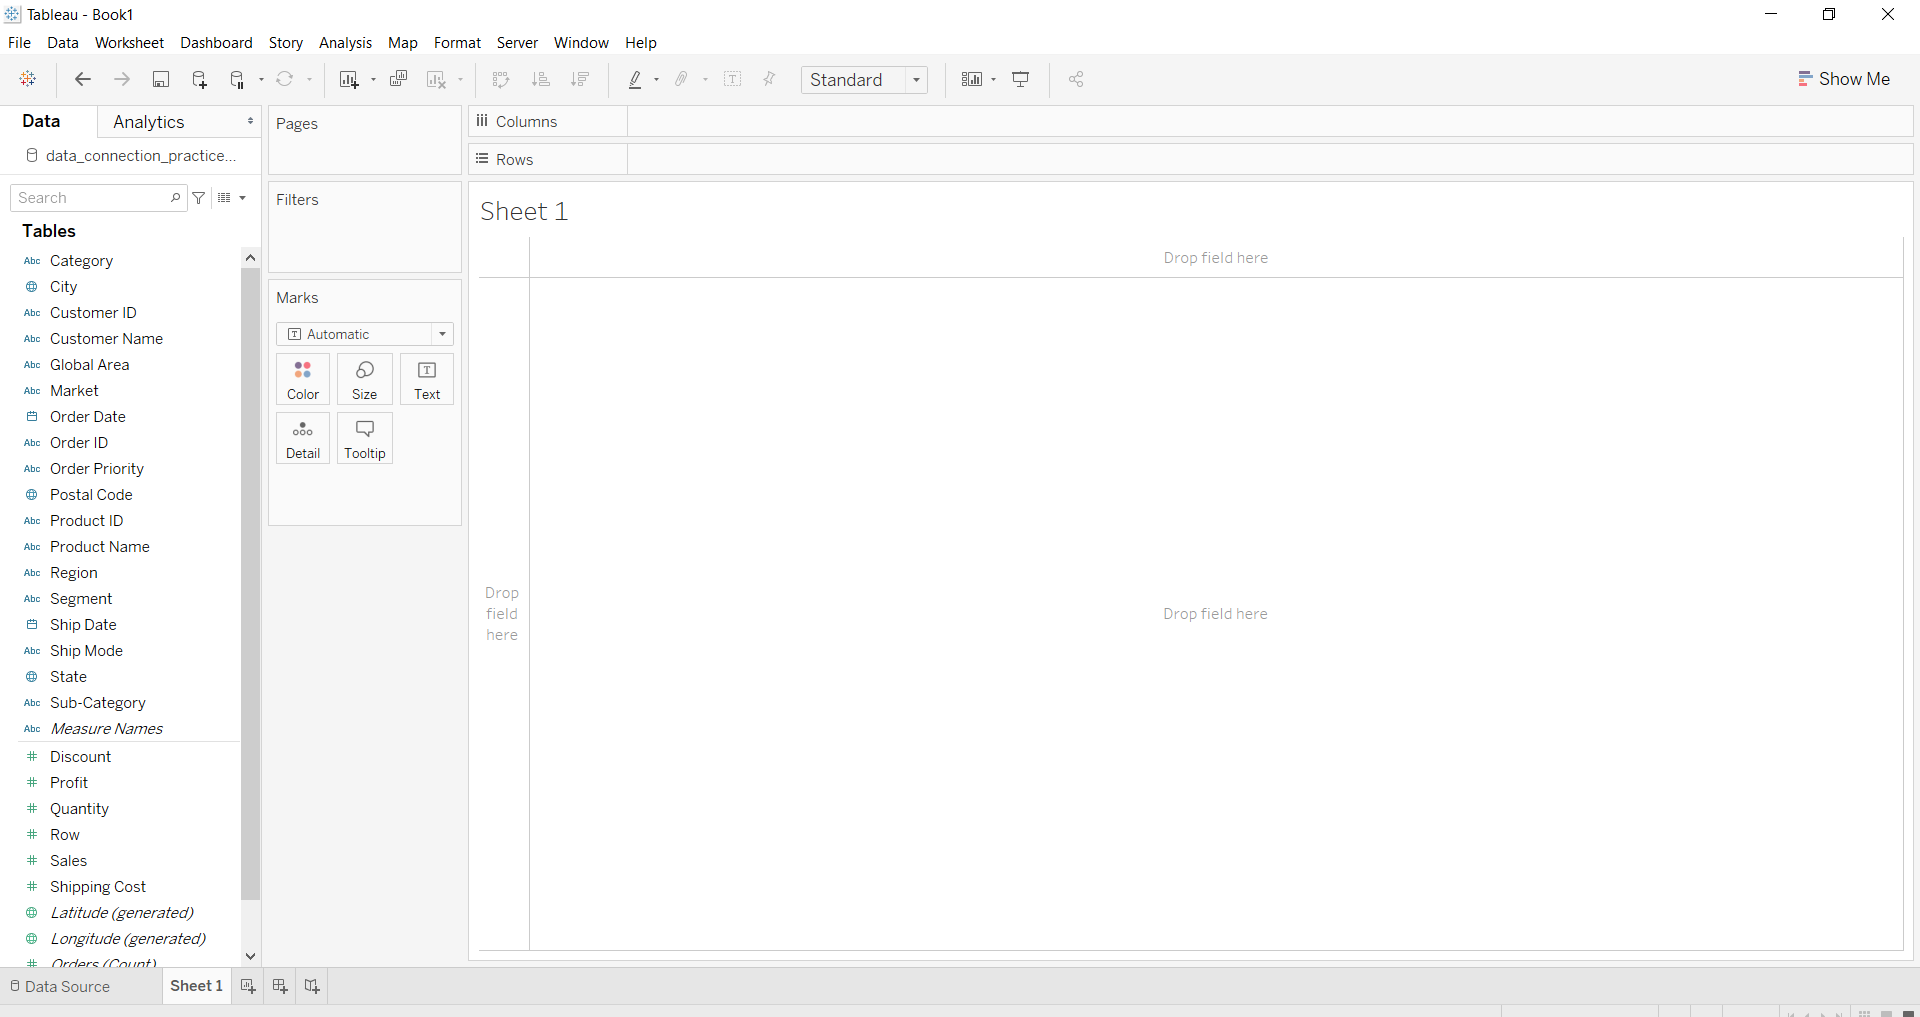
- Open the Tableau tool and connect a dataset into it.
- Drag and drop the one sheet of the connected dataset.
- Click on sheet1 to open the tableau worksheet.
- On clicking Sheet1 you will get whole dataset attributes on the left side and a worksheet for work.
- Draw a graph to visualize the data and then apply the filtering technique.
Here, the visualization part is filtered according to the field and aggregation function on that field. In which you can apply the limit on values generated from aggregated function. The limited values (which pass the limit) are applied on the graph to filter the visualization. This is mostly used when users want some limited data to analyze.
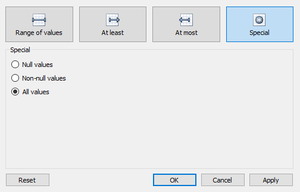
We can apply filters with these 4 conditions:
- Range of Values
- At least
- At most
- Special – To filter null values.
The filter window looks like this:
Example 1: Filtering data so that only values with a minimum of 440000 are displayed.
Example 2: Filtering data so that it is within a range of -10 to 10.
Like Article
Suggest improvement
Share your thoughts in the comments
Please Login to comment...