Export Plot to EPS File in R
Last Updated :
16 May, 2021
An EPS file is a graphics file saved in the Encapsulated PostScript (EPS) file format. The EPS files may contain images, graphics, or even text. In this article, we will discuss how we export a plot to an EPS file using R programming language.
Method 1 : Using setEPS() method
The postscripts can be defined using the setEPS() method in R. postscript initiates the graphics device driver for producing PostScript graphics. The eps file is stored in the current working directory by default. To save it to a specific location specify the full destination path along with the name of the file in postscript() function.
Example:
R
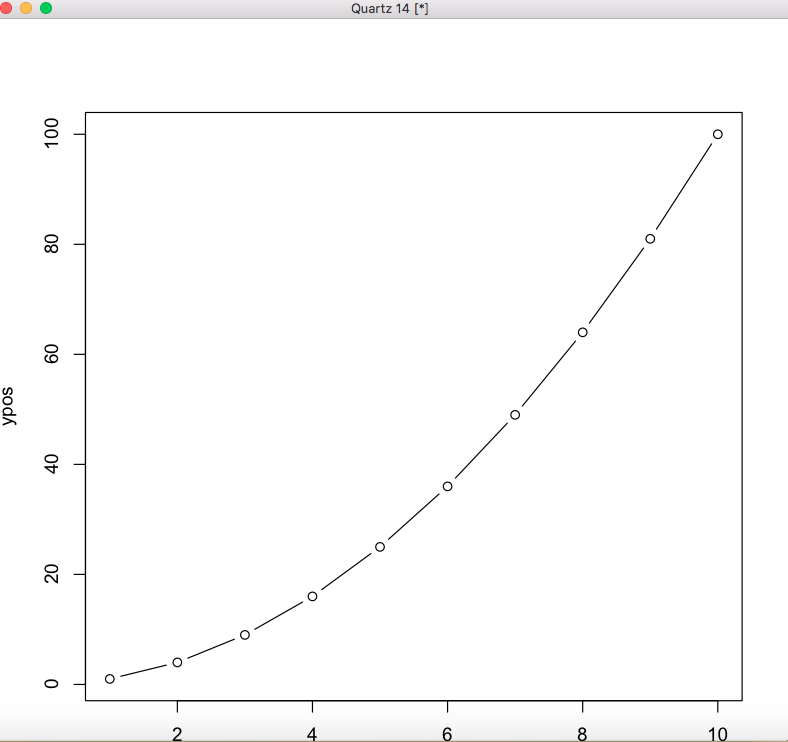
xpos <- c(1:10)
ypos <- xpos^2
setEPS()
postscript("gfg.eps")
plot(xpos,ypos)
dev.off()
|
Output
Method 2: Using ggplot2
The ggplot library can be installed and loaded into the working space to work with graphics.The ggplot() method in this package is used to visualize data in the form of scatter plots, boxplots, and time series plots. This method is fed the data in the form of data points, and then a scatter plot is displayed. In this function, an aesthetic mapping(aes) is deployed by selecting the variables x and y and further customized by the addition of a graphical representation of data in the form of points using the geom_point() method in the graph. The plot can be saved in the eps format using the ggplot.save() method, which takes as argument the string name of the plot.
Example:
R
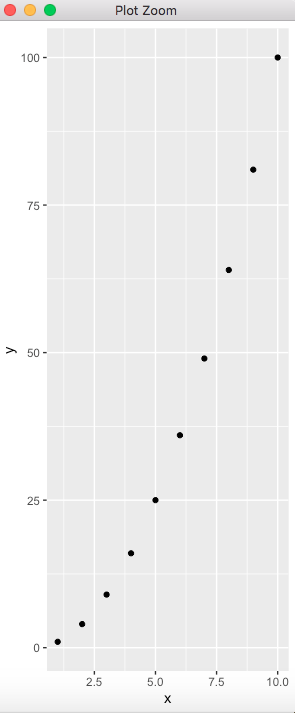
library("ggplot2")
xpos <- 1:10
ypos <- xpos^2
data_frame <- data.frame(x = xpos,
y = ypos)
ggplot(data_frame, aes(x, y)) + geom_point()
ggplot.save("gfg.eps")
|
Output
Share your thoughts in the comments
Please Login to comment...