Exponential Distribution in R Programming – dexp(), pexp(), qexp(), and rexp() Functions
Last Updated :
11 Mar, 2024
The exponential distribution in R Language is the probability distribution of the time between events in a Poisson point process, i.e., a process in which events occur continuously and independently at a constant average rate. It is a particular case of the gamma distribution. In R Programming Language, there are 4 built-in functions to generate exponential distribution:
Function
| Description
|
dexp
| Probability Density Function
|
pexp
| Cumulative Distribution Function
|
qexp
| Quantile Function of Exponential Distribution
|
rexp
| Generating random numbers which are Exponentially Distributed
|
What is Exponential Distribution?
A random variable X is said to be exponentially distributed if it has a mean equal to 1 / λ and variance is equal to 1 / λ2 then that variable is known as Exponential Distribution.
[Tex]f\left(x \right ) = \lambda\; e^{-\lambda x}[/Tex]
dexp() Function
The dexp() function returns the corresponding values of the exponential density for an input vector of quantiles.
Syntax:
dexp(x_dexp, rate)
Example:
R
x_dexp <- seq(1, 10, by = 0.1)
y_dexp <- dexp(x_dexp, rate = 5)
plot(y_dexp)
|
Output:

Exponential Distribution in R
pexp() Function
The pexp() function returns the corresponding values of the exponential cumulative distribution function for an input vector of quantiles.
Syntax:
pexp(x_pexp, rate )
R
x_pexp <- seq(1, 10, by = 0.2)
y_pexp <- pexp(x_pexp, rate = 1)
plot(y_pexp)
|
Output :
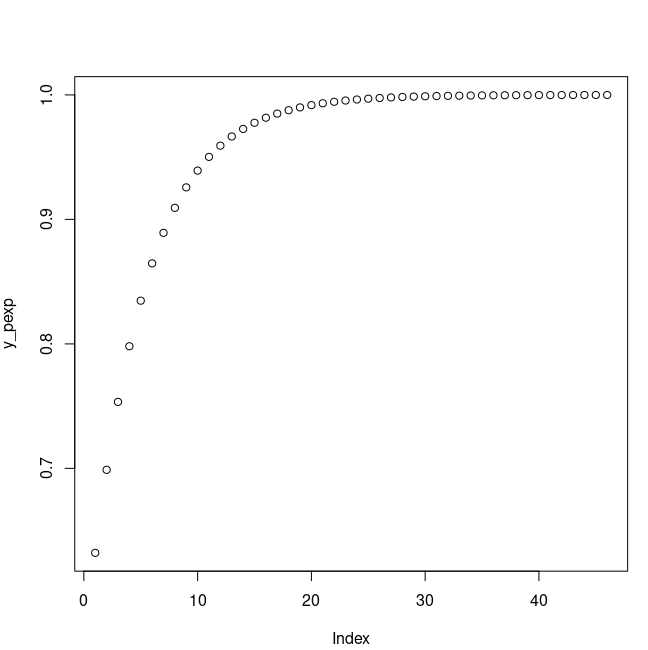
Cumulative Exponential Distribution Function
qexp() Function
The qexp() function gives the possibility, we can use the qexp function to return the corresponding values of the quantile function.
Syntax:
qexp(x_qexp, rate)
R
x_qexp <- seq(0, 1, by = 0.2)
y_qexp <- qexp(x_qexp, rate = 1)
plot(y_qexp)
|
Output:

Quantile Function of Exponential Distribution
rexp() Function
The rexp() function is used to simulate a set of random numbers drawn from the exponential distribution.
Syntax:
rexp(N, rate )
R
set.seed(500)
N <- 100
y_rexp <- rexp(N, rate = 1)
hist(y_rexp, breaks = 50, main = "")
|
Output:
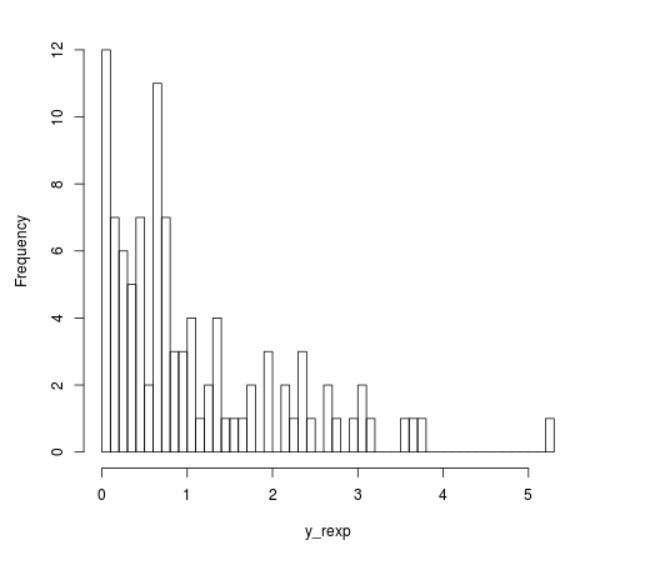
Histogram of 100 Exponentially Distributed Numbers
Like Article
Suggest improvement
Share your thoughts in the comments
Please Login to comment...