In Python, exploratory data analysis, or EDA, is a crucial step in the data analysis process that involves studying, exploring, and visualizing information to derive important insights. To find patterns, trends, and relationships in the data, it makes use of statistical tools and visualizations. This helps to formulate hypotheses and direct additional investigations.
Python provides strong EDA tools with its diverse library ecosystem, which includes Seaborn, Matplotlib, and Pandas. An essential phase in the data science pipeline, this procedure improves data comprehension and provides information for further modeling decisions.
Exploratory Data Analysis(EDA) is the main step in the process of various data analysis. It helps data to visualize the patterns, characteristics, and relationships between variables. Python provides various libraries used for EDA such as NumPy, Pandas, Matplotlib, Seaborn, and Plotly.
In this article, we will explore What is Exploratory data analysis using Python.
What is Exploratory Data Analysis (EDA)?
EDA is a phenomenon under data analysis used for gaining a better understanding of data aspects like:
- main features of data
- variables and relationships that hold between them
- Identifying which variables are important for our problem
We shall look at various exploratory data analysis methods like:
- Reading dataset
- Analyzing the data
- Checking for the duplicates
- Missing Values Calculation
- Exploratory Data Analysis
- Univariate Analysis
- Bivariate Analysis
- Multivariate Analysis
What is Preprocessing and Data Engineering?
When referring to data preparation and cleaning, preprocessing is done before raw data is entered into an analytical tool or machine learning model. Missing value handling, feature scaling, categorical variable encoding, and outlier removal are all part of it. To improve the performance and interpretability of the model, it is important to make sure the data is in the right format. Data-driven jobs are more successful overall when preprocessing is used to reduce noise, standardize data, and optimize it for effective analysis.
The practical application of ideas, techniques, and technology for gathering, storing, analyzing, and organizing massive amounts of data is known as data engineering. It includes building reliable data architectures, constructing data pipelines, and putting in place mechanisms that make information flow easier. Data engineers ensure data quality, dependability, and accessibility while building the infrastructure needed to support data-driven applications. Data engineering is a fundamental component of the larger data science and analytics ecosystem because it helps firms extract meaningful insights from their data.
Step 1: Importing Required Libraries
Python3
import pandas as pd
import numpy as np
import matplotlib.pyplot as plt
import seaborn as sns
import warnings as wr
wr.filterwarnings('ignore')
|
Understanding and experimenting with our data using libraries is the first step in utilizing Python for machine learning. The dataset can be accessed via this link.
Import all of the libraries needed for our investigation, including those for data loading, statistical analysis, visualizations, univariate and bivariate analysis, etc.
Step 2: Reading Dataset
Python3
df = pd.read_csv("winequality-red.csv")
print(df.head())
|
Output:
   fixed acidity  volatile acidity  citric acid  residual sugar  chlorides  \
0            7.4              0.70         0.00             1.9      0.076
1            7.8              0.88         0.00             2.6      0.098
2            7.8              0.76         0.04             2.3      0.092
3           11.2              0.28         0.56             1.9      0.075
4            7.4              0.70         0.00             1.9      0.076
   free sulfur dioxide  total sulfur dioxide  density    pH  sulphates  \
0                 11.0                  34.0   0.9978  3.51       0.56
1                 25.0                  67.0   0.9968  3.20       0.68
2                 15.0                  54.0   0.9970  3.26       0.65
3                 17.0                  60.0   0.9980  3.16       0.58
4                 11.0                  34.0   0.9978  3.51       0.56
   alcohol  quality
0      9.4        5
1      9.8        5
2      9.8        5
3      9.8        6
4      9.4        5
Step 3: Analyzing the Data
Gaining general knowledge about the data—including its values, kinds, number of rows and columns, and missing values—is the primary objective of data understanding.
shape: shape will show how many features (columns) and observations (rows) there are in the dataset.
Output:
(1599, 12)
info() facilitates comprehension of the data type and related information, such as the quantity of records in each column, whether the data is null or not, the type of data, and the dataset’s memory use.
Output:
<class 'pandas.core.frame.DataFrame'>
RangeIndex: 1599 entries, 0 to 1598
Data columns (total 12 columns):
 #   Column                Non-Null Count  Dtype
---  ------                --------------  -----
 0   fixed acidity         1599 non-null   float64
 1   volatile acidity      1599 non-null   float64
 2   citric acid           1599 non-null   float64
 3   residual sugar        1599 non-null   float64
 4   chlorides             1599 non-null   float64
 5   free sulfur dioxide   1599 non-null   float64
 6   total sulfur dioxide  1599 non-null   float64
 7   density               1599 non-null   float64
 8   pH                    1599 non-null   float64
 9   sulphates             1599 non-null   float64
 10  alcohol               1599 non-null   float64
 11  quality               1599 non-null   int64
dtypes: float64(11), int64(1)
memory usage: 150.0 KB
Description of the data
Output:
       fixed acidity  volatile acidity  citric acid  residual sugar  \
count    1599.000000       1599.000000  1599.000000     1599.000000
mean        8.319637          0.527821     0.270976        2.538806
std         1.741096          0.179060     0.194801        1.409928
min         4.600000          0.120000     0.000000        0.900000
25%         7.100000          0.390000     0.090000        1.900000
50%         7.900000          0.520000     0.260000        2.200000
75%         9.200000          0.640000     0.420000        2.600000
max        15.900000          1.580000     1.000000       15.500000
         chlorides  free sulfur dioxide  total sulfur dioxide      density  \
count  1599.000000          1599.000000           1599.000000  1599.000000
mean      0.087467            15.874922             46.467792     0.996747
std       0.047065            10.460157             32.895324     0.001887
min       0.012000             1.000000              6.000000     0.990070
25%       0.070000             7.000000             22.000000     0.995600
50%       0.079000            14.000000             38.000000     0.996750
75%       0.090000            21.000000             62.000000     0.997835
max       0.611000            72.000000            289.000000     1.003690
                pH    sulphates      alcohol
count  1599.000000  1599.000000  1599.000000
mean      3.311113     0.658149    10.422983
std       0.154386     0.169507     1.065668
min       2.740000     0.330000     8.400000
25%       3.210000     0.550000     9.500000
50%       3.310000     0.620000    10.200000
75%       3.400000     0.730000    11.100000
max       4.010000     2.000000    14.900000
The DataFrame “df” is statistically summarized by the code df.describe(), which gives the count, mean, standard deviation, minimum, and quartiles for each numerical column. The dataset’s central tendencies and spread are briefly summarized.
Checking Columns
Output:
['fixed acidity',
 'volatile acidity',
 'citric acid',
 'residual sugar',
 'chlorides',
 'free sulfur dioxide',
 'total sulfur dioxide',
 'density',
 'pH',
 'sulphates',
 'alcohol',
 'quality']
The code df.columns.tolist() converts the column names of the DataFrame ‘df’ into a Python list, providing a convenient way to access and manipulate column names.
Checking Missing Values
Output:
fixed acidity           0
volatile acidity        0
citric acid             0
residual sugar          0
chlorides               0
free sulfur dioxide     0
total sulfur dioxide    0
density                 0
pH                      0
sulphates               0
alcohol                 0
quality                 0
dtype: int64
The code df.isnull().sum() checks for missing values in each column of the DataFrame ‘df’ and returns the sum of null values for each column
Checking for the duplicate values
Output:
fixed acidity            96
volatile acidity        143
citric acid              80
residual sugar           91
chlorides               153
free sulfur dioxide      60
total sulfur dioxide    144
density                 436
pH                       89
sulphates                96
alcohol                  65
quality                   6
dtype: int64
The function df.nunique() determines how many unique values there are in each column of the DataFrame “df,” offering information about the variety of data that makes up each feature.
Exploratory Data Analysis
EDA is a vital step in the data analysis process that entails visually and statistically analyzing datasets to find patterns, trends, and insights.
The principal goals of exploratory data analysis (EDA) are to detect anomalies in the dataset and develop recommendations for additional investigation, thereby guaranteeing a thorough comprehension of the subtleties of the data.
To obtain a comprehensive understanding of the data, analysts use a variety of EDA approaches, including summary statistics, correlation analysis, and data visualization using tools like box plots, scatter plots, and histograms.
EDA provides insightful information that helps with hypothesis creation and decision-making by improving knowledge of data distribution, variable correlations, and anomalies. When all is said and done, the efficacy of data-driven projects is enhanced by EDA’s capacity to identify trends and anomalies.
Step 4: Univariate Analysis
In Univariate analysis, plotting the right charts can help us better understand the data, which is why data visualization is so important. Matplotlib and Seaborn libraries are used in this post to visualize our data.
Basic charts can be created with Matplotlib, a Python 2D charting package.
Seaborn is a Python library that leverages short code segments to generate and customize statistical charts from Pandas and Numpy, based on the Matplotlib framework.
For both numerical and categorical data, univariate analysis is an option.
In this example, we are going to plot different types of plots like swarmplots, violinplots, and countplots for univariate analysis.
Python3
quality_counts = df['quality'].value_counts()
plt.figure(figsize=(8, 6))
plt.bar(quality_counts.index, quality_counts, color='darpink')
plt.title('Count Plot of Quality')
plt.xlabel('Quality')
plt.ylabel('Count')
plt.show()
|
Output:
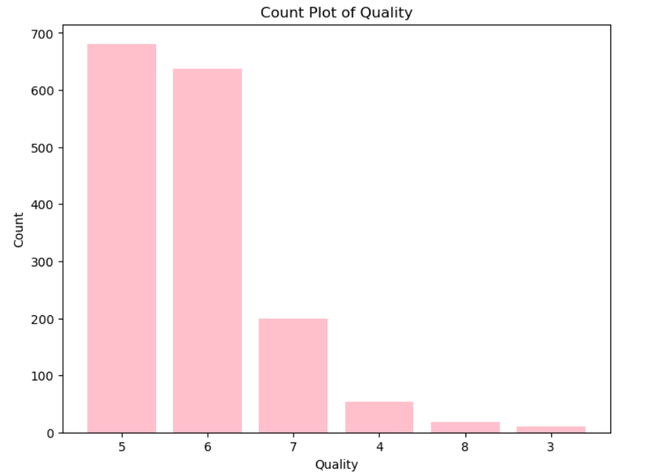
Here , this count plot graph shows the count of the wine with its quality rate.
Kernel Density Plots
Python3
sns.set_style("darkgrid")
numerical_columns = df.select_dtypes(include=["int64", "float64"]).columns
plt.figure(figsize=(14, len(numerical_columns) * 3))
for idx, feature in enumerate(numerical_columns, 1):
plt.subplot(len(numerical_columns), 2, idx)
sns.histplot(df[feature], kde=True)
plt.title(f"{feature} | Skewness: {round(df[feature].skew(), 2)}")
plt.tight_layout()
plt.show()
|
Output:
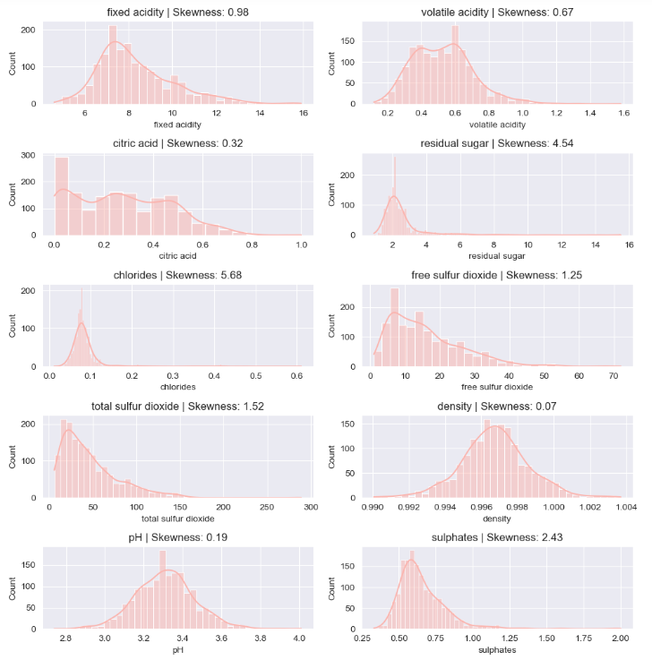
Here, in the kernel density plot is about the skewness of the of the corresponding feature. The features in this dataset that have skewness are exactly 0 depicts the symmetrical distribution and the plots with skewness 1 or above 1 is positively or right skewd distribution. In right skewd or positively skewed distribution if the tail is more on the right side, that indicates extremely high values.
Swarm Plot
Python3
plt.figure(figsize=(10, 8))
sns.swarmplot(x="quality", y="alcohol", data=df, palette='viridis')
plt.title('Swarm Plot for Quality and Alcohol')
plt.xlabel('Quality')
plt.ylabel('Alcohol')
plt.show()
|
Output:
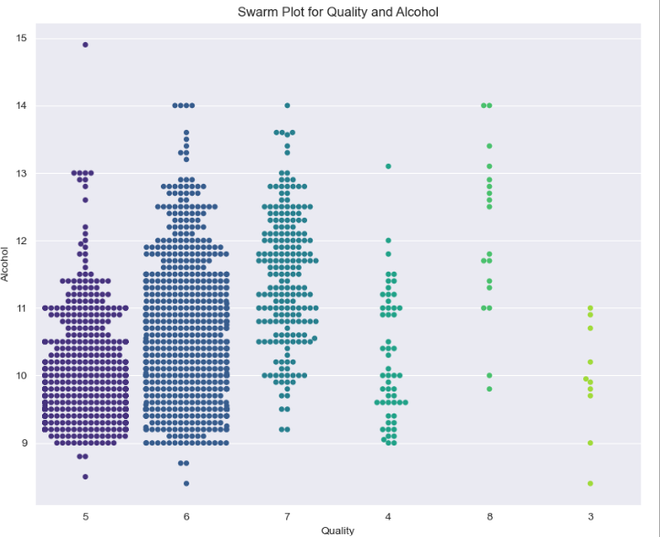
This graph shows the swarm plot for ‘Quality’ and ‘Alcohol’ column. This plot depicts that the higher point density in specific regions shows the concentration indicating where the majority of data points cluster. The points isolated and are far away from the clusters shows the outliers.
Step 5: Bivariate Analysis
When doing a bivariate analysis, two variables are examined simultaneously in order to look for patterns, dependencies, or interactions between them. Understanding how changes in one variable may correspond to changes in another requires the use of this statistical method.
Bivariate analysis allows for a thorough comprehension of the interdependence between two variables within a dataset by revealing information on the type and intensity of associations.
Let’s plot a pair plot for the data.
Pair Plot
Python3
sns.set_palette("Pastel1")
plt.figure(figsize=(10, 6))
sns.pairplot(df)
plt.suptitle('Pair Plot for DataFrame')
plt.show()
|
Output:
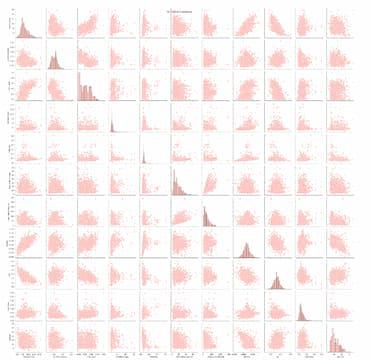
- If the plot is diagonal , histograms of kernel density plots , is shows the distribution of the individual variables.
- If the scatter plot is in the lower triangle, it displays the relationship between the pairs of the variables.
- If the scatter plots above and below the diagonal are mirror images, indicating symmetry.
- If the histogram plots are more centered, it represents the locations of peaks.
- Skewness is depicted by observing whether the histogram is symmetrical or skewed to the left or right.
Violin Plot
Python3
df['quality'] = df['quality'].astype(str)
plt.figure(figsize=(10, 8))
sns.violinplot(x="quality", y="alcohol", data=df, palette={
'3': 'lightcoral', '4': 'lightblue', '5': 'lightgreen', '6': 'gold', '7': 'lightskyblue', '8': 'lightpink'}, alpha=0.7)
plt.title('Violin Plot for Quality and Alcohol')
plt.xlabel('Quality')
plt.ylabel('Alcohol')
plt.show()
|
Output:
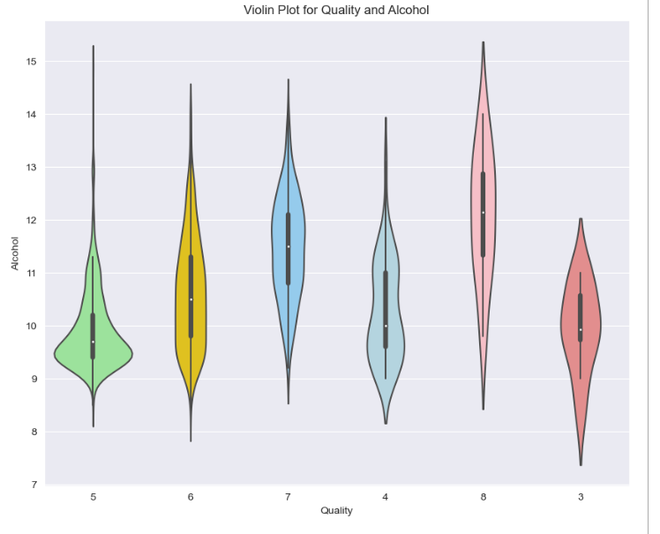
For interpreting the Violin Plot,
- If the width is wider, it indicates higher density, suggesting more data points.
- Symmetrical plot indicates a balanced distribution.
- Peak or bulge in the violin plot represents most common value in distribution.
- Longer tails indicate great variability.
- Median line is the middle line inside the violin plot. It helps in understanding central tendencies.
Box Plot
Python3
sns.boxplot(x='quality', y='alcohol', data=df)
|
Output:
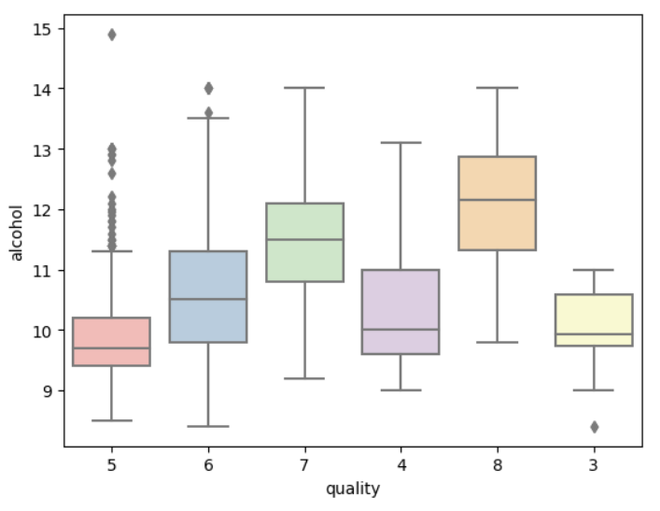
For interpreting the box plot,
- Box represents the IQR. Longer the box, greater the variability.
- The median line in the box indicates central tendency.
- Whiskers extend from box to the smallest and largest values within a specified range.
- Individual points beyond the whiskers represents outliers.
- A compact box indicates low variability while a stretched box indicates higher variability.
Step 6: Multivariate Analysis
Interactions between three or more variables in a dataset are simultaneously analyzed and interpreted in multivariate analysis.
In order to provide a comprehensive understanding of the collective behavior of several variables, it seeks to reveal intricate patterns, relationships, and interactions between them.
Multivariate analysis examines correlations and dependencies between numerous variables by using sophisticated statistical techniques such factor analysis, principal component analysis, and multivariate regression.
Multivariate analysis, which is widely applied in domains such as biology, economics, and marketing, enables thorough insights and helps decision-makers make well-informed judgments based on complex relationships found in multidimensional datasets.
Here, we are going to show the multivariate analysis using a correlation matrix plot.
Correlation Matrix
Python3
plt.figure(figsize=(15, 10))
sns.heatmap(df.corr(), annot=True, fmt='.2f', cmap='Pastel2', linewidths=2)
plt.title('Correlation Heatmap')
plt.show()
|
Output:
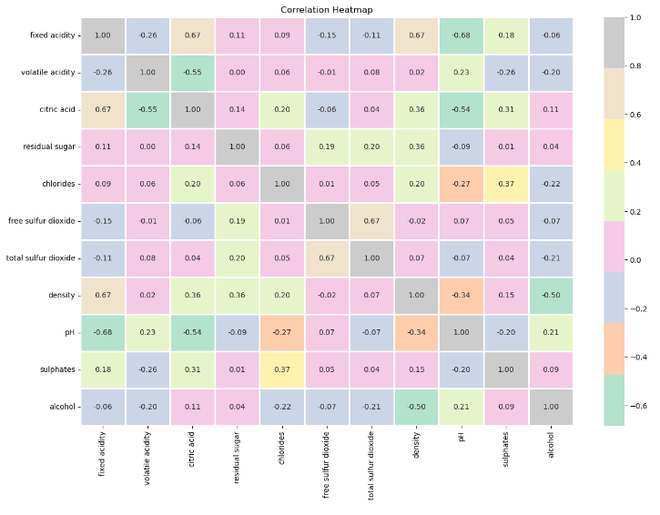
For interpreting a correlation matrix plot,
- Values close to +1 indicates strong positive correlation, -1 indicates a strong negative correlation and 0 indicates suggests no linear correlation.
- Darker colors signify strong correlation, while light colors represents weaker correlations.
- Positive correlation variable move in same directions. As one increases, the other also increases.
- Negative correlation variable move in opposite directions. An increase in one variable is associated with a decrease in the other.
Conclusion
In summary, the Python-based exploratory data analysis (EDA) of the wine dataset has yielded important new information about the properties of the wine samples. We investigated correlations between variables, identified outliers, and obtained a knowledge of the distribution of important features using statistical summaries and visualizations. The quantitative and qualitative features of the dataset were analyzed in detail through the use of various plots, including pair, box, and histogram plots. Finding patterns, trends, and possible topics for more research was made easier by this EDA method. Furthermore, the analysis demonstrated the ability to visualize and analyze complicated datasets using Python tools such as Matplotlib, Seaborn, and Pandas. The results provide a thorough grasp of the wine dataset and lay the groundwork for more in-depth studies and modeling.
Like Article
Suggest improvement
Share your thoughts in the comments
Please Login to comment...