Descriptive Statistics in Excel
Last Updated :
06 Dec, 2023
Obtaining descriptive statistics for data collection may be helpful if you frequently work with huge datasets in Excel. A few key data points are provided by descriptive statistics, which you can utilize to quickly grasp the complete data set.
Although you can calculate each of the statistical variables separately, using Excel’s descriptive statistics feature allows you to rapidly get all this information in one location.
What is Descriptive Statistics in Excel
Descriptive statistics is all about describing the given data. To describe the data, we use measures of central tendency and measures of dispersion. In this article, we explain how to use “Data Analysis” in Excel for descriptive statistics in detail.
Measures of Central Tendency [Mean, Median, and Mode]
A single number about the centre of the data points. Where the majority of the values in the dataset are found is indicated by a measure of central tendency. It sits in the middle of the range of values. Three central tendency measures are provided by Excel.
- Mean: It is calculated by dividing the total number of observations by their number. It works best with symmetrically distributed data.
- Median: Your data is divided in half by this value. Half of the results are higher than the median, and the other half are lower.
- Mode: The value that appears the most frequently in your data is represented by this metric. For categorical and ordinal data, it works best.
What are Measures of Dispersion in Excel [Range, Variance and Standard Deviation]
Dispersion measurements show how tightly or loosely distributed the data points are around the centre. Three dispersion measures are provided by Excel. Generally, data points move away from the centre as their values rise.
- Range: It is the discrepancy between a dataset’s largest and smallest values. The range is simple to comprehend, but it is highly prone to outliers because it is based simply on the two most extreme values in the dataset.
- Variance: It depicts the values’ average squared deviation from the mean. The variance is expressed in squared units rather than the original data units because the calculations use squared differences.
- Standard Deviation: The normal or average deviation of each data point from the mean. This measure simplifies understanding because it utilizes the original units of the data. The variance’s square root gives the standard deviation.
You must have the Data Analysis Toolpak enabled in order to access the descriptive statistics in Excel.
How to Enable Data Analysis Toolpak
The procedures to enable the Data Analysis Toolpak in Excel are listed below:
Step 1. Launch any Excel file, Go to the File tab
Step 2. Select Options, the Excel Options dialogue box will appear as a result
File tab

File tab
Step 3. In the left pane of the Excel Options dialogue box, select Add-ins
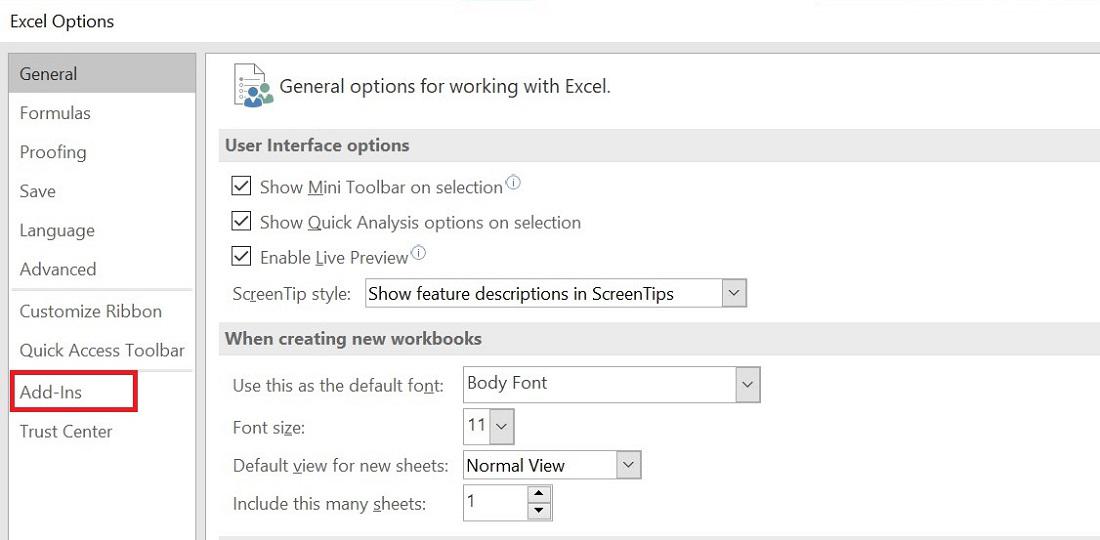
Excel Options dialogue box
Step 4. Choose “Excel Add-ins” from the Manage drop-down menu
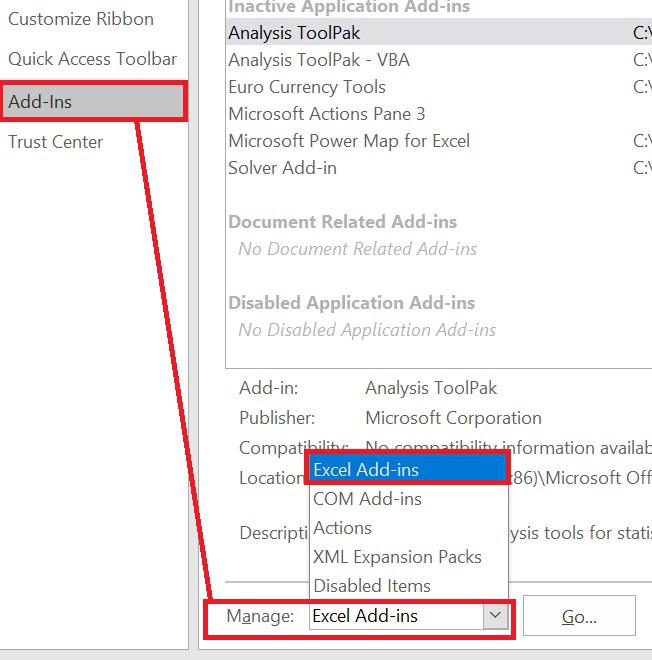
Manage drop-down menu
Step 5. Press the “Go” button
Step 6. Check the Analysis Toolpak box when the Add-ins dialogue box appears and Click OK
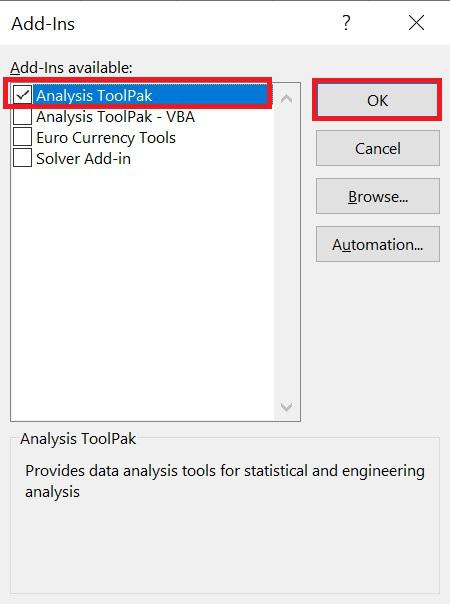
Add-ins dialogue box
Well Done! You’ve now enabled Data Analysis Toolpak and is ready to use.
How to Get Descriptive Statistics in Excel?
Let’s look at how to obtain the descriptive statistics using the Data Analysis Toolpak now that it is enabled.
Example: We have given shirt size of 20 men in the below table.
Sample data

Follow the below steps to implement descriptive statistics on sample data:
Step 1. Go to “Data” >> Click “Data Analysis” (Image 1) – to pop up the “Data Analysis” Dialogue box. If you cannot find “Data analysis” in Excel ribbon. The end of this article finds the steps [To provide “Data Analysis”]
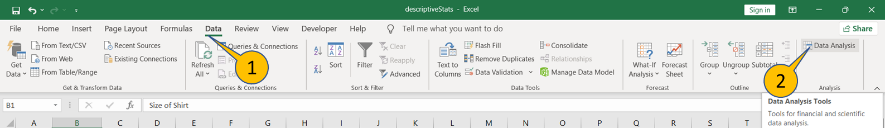
Image 1
Step 2. In Data Analysis, Select “Descriptive Statistics” and Press “OK” – To pop-up “Descriptive statistics” Dialogue box for further input

Step 3. Make sure the below options are selected in “Descriptive statistics” and Press “OK”
Input Range: “$B$1:$B$21”
Grouped By: Columns
Labels in first row: Checked
Output Range: $D$5
Summary statistics: Checked

Output
Descriptive statistics Output in Table “D5:E19”

Like Article
Suggest improvement
Share your thoughts in the comments
Please Login to comment...