Have you ever analyzed any data? What does it mean? Well, analyzing any kind of data means interpreting, collecting, transforming, cleaning, and visualizing data to discover valuable insights that drive smarter and more effective decisions related to business or anywhere you need it. So, Excel solves a big problem as you can use functions to analyze your data.
In Excel, there are around 475 functions for analyzing a data set. It becomes so hard to remember each and every function in Excel. Sometimes people try to use calculation manually rather than calculating on Excel as using many functions becomes complicated for them. Thus, there are some important and top Excel Data Analysis Functions that you can try, and that will help you a lot.
Power of Data Analysis Functions
At its core, data analysis involves deciphering intricate patterns, drawing meaningful conclusions, and informing critical decisions. Excel’s data analysis functions serve as the building blocks for this process, allowing users to perform calculations, manipulate data, and visualize trends with ease.
Let’s start learning the Function!
TopData Analysis Functions in Excel
Whether you are a Data analyst or someone who uses Excel for calculation or for small business, These functions are for everyone. These functions will ease your data analyst task:
IF Function: Automated Decision- Making
The IF function in Excel is an invaluable tool that empowers us to automate decision-making processes within our spreadsheets. Ir serves as a digital decision-maker, allowing us to seamlessly incorporate logic and conditional actions.
With the IF Function, we unlock the capability to execute distinct calculations or present different values based on the outcome of a logical test- an essential feature for data-driven scenarios.
The IF Function operates by prompting us to define the logical test to perform. It then enables us to specify the action to be taken if the test yields a true result, as well as an alternative action if the test results in a false outcome.
The Formula for Using IF Function:
=IF(logical test, value if true, value if false)
.png)
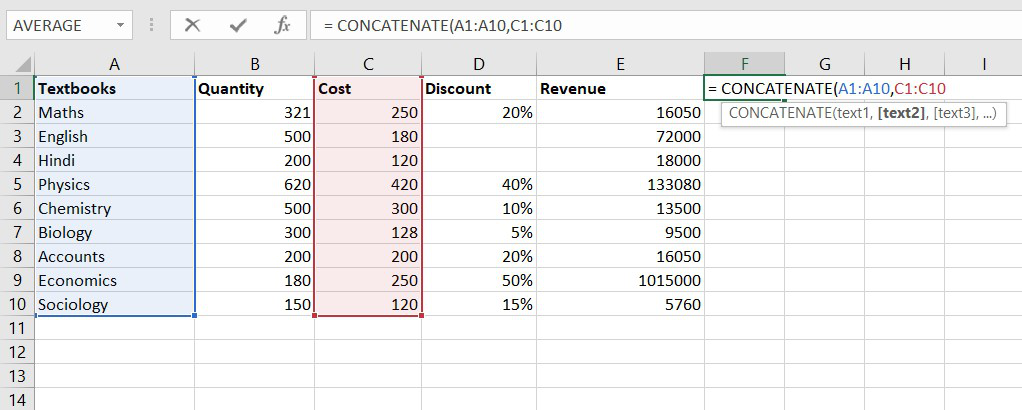
CONCATENATE Function: Merging Data Elements
Concatenate is the easiest function to understand but the most useful one. It will combine text, numbers, and dates from multiple cells into one. This will be helpful for analyzing data and also helps at the time of creating JAVA queries.
The formula for using CONCATENATE function:
=CONCATENATE(text1,[text2], [text3]…)
 Example of Data Analysis Function
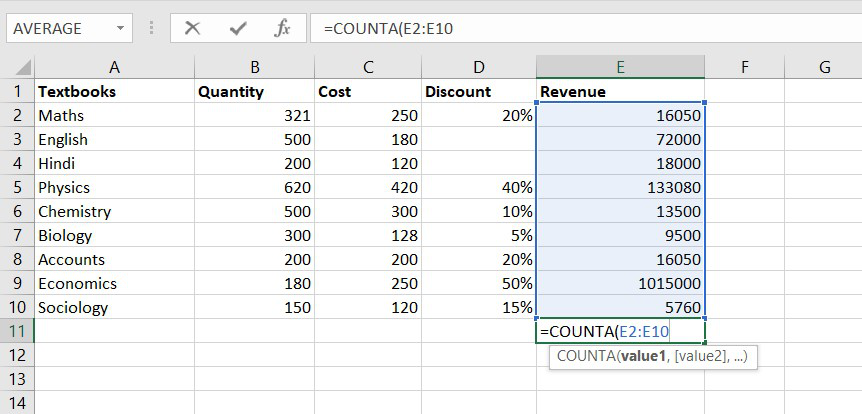
COUNTA Function: Quantifying Non-Blank Cells
The COUNTA function counts the number of cells that are not blank, it counts a number of cells whether it contains a text, number, or an error message. But, keep in mind COUNTA function does not count empty cells.
The formula for the Non-BlankCOUNTA function :
= COUNT(value1, [value2], …)
 Example of Data Analysis Function
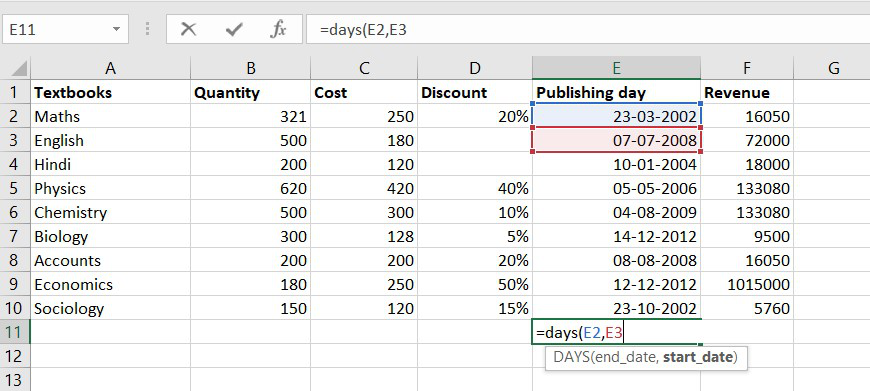
DAYS Function: Calculating Time Intervals
DAYS function is used to find the number of days between two calendar dates. This is a very helpful analyzing function. Let’s look at the formula.
The formula for DAYS function:
= DAYS(end_date, start_date)
 Example of Data Analysis Function
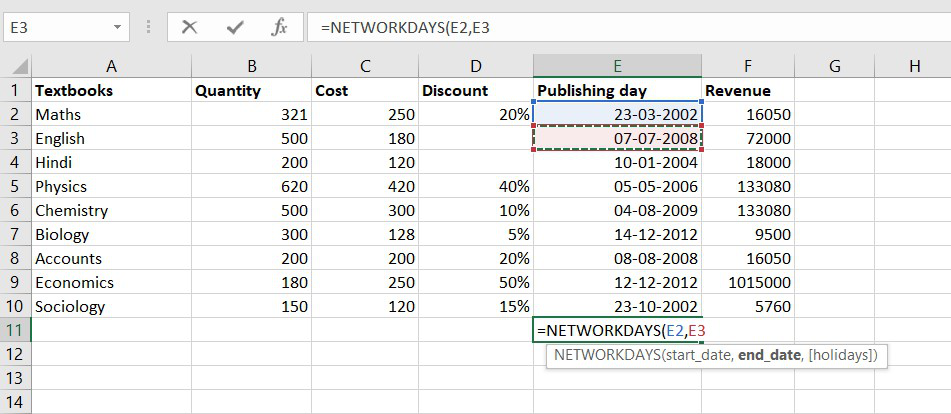
NETWORKDAYS Function: Working Days Calculation
The NETWORKDAYS function is a date-time function used to calculate the number of working days between two calendar dates. It will exclude weekends and holidays.
The formula for DAYS function:
= DAYS(end_date, start_date)
 Example of Data Analysis Function
SUMIFS Function: Multi-Condition Aggregation
The function will work on one or more than one condition in a given range and adds all the cell arguments that will meet the conditions.
The formula for the SUMIFS function:
= SUMIFS(sum_range, criteria_range1, criteria1, [criteria_range2, criteria2], …)
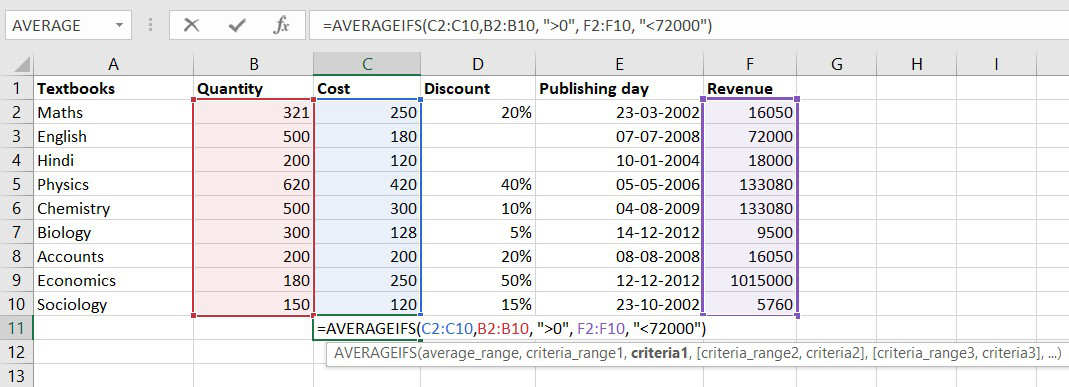
AVERAGEIFS Function: Multi-Condition Averaging
The function will calculate the average of all the cells that will meet multiple conditions.
The formula for the SUMIFS function:
=AVERAGEIF (range, criteria, [average_range])
 Example of Data Analysis Function
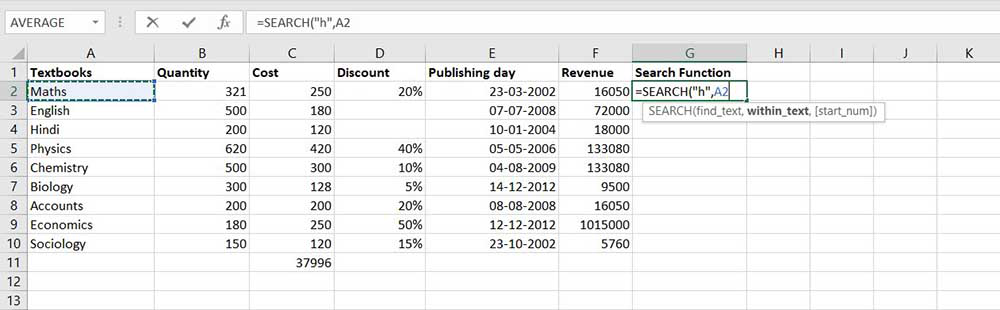
SEARCH Function: Navigating Extensive Datasets
This function is again a very powerful tool when you deal with big data. You can find any data entry through this function. One important thing to note there is a difference between the FIND and SEARCH functions, as FIND is used for case-sensitive matches only but SEARCH will find both types of words (capitals and small).
The formula for the SEARCH function:
=SEARCH(find_text, within_text, [start_num])
 Example of Data Analysis Function
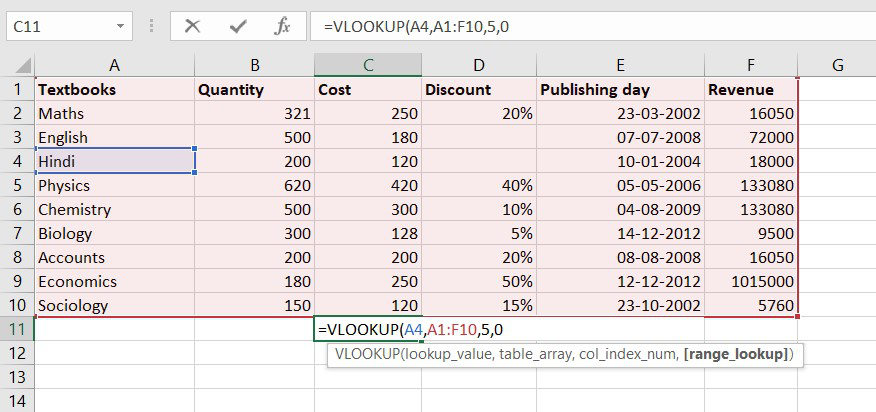
VLOOKUP Function: Relational Data Retrieval
Basically, the VLOOKUP function stands for Vertical Lookup, so the function will find the specific value in the column in order to return a value from a different column in the same row.
The formula for the VLOOKUP function:
= (lookup_value, table_array, col_index_num, [range_lookup])
 Example of Data Analysis Function
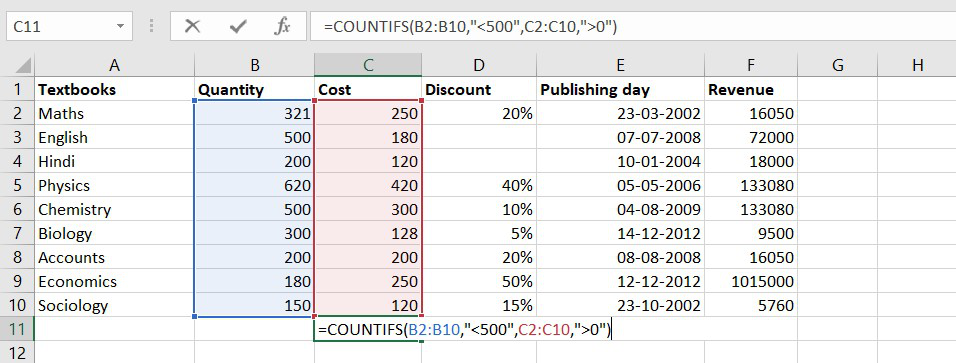
COUNTIFS Function: Multi-Condition Counting
The COUNTIFS function is the most used function in Excel. The function will work on one or more than one condition in a given range and counts the cell that meets the condition.
The formula for the COUNTIFS function:
= COUNTIFS (range1, criteria1, [range2], [criteria2], …)
 Example of Data Analysis Function
SUMPRODUCT Function: Multiplicative Aggregation
It is an inbuilt function in Excel, it will return the sum of products of the value given in the argument or an array. This function usually uses when you need to multiply many cells together.
The formula for SUMPRODUCT function:
= SUMPRODUCT ( array1, [array2],[array3],…)
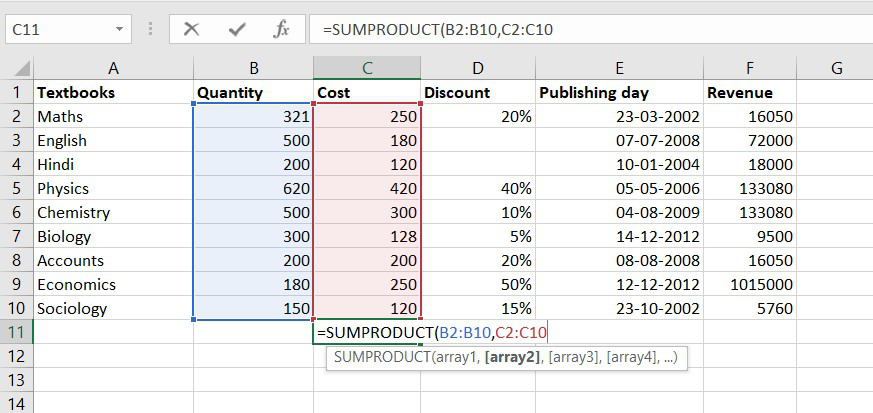 Example of Data Analysis Function
Conclusion
However, the realm of Excel’s capabilities extends far beyond these functions, encompassing a multitude of features waiting to be explored. Aspiring to become a data analysis virtuoso delving into a broader spectrum of functions and tools. Two indispensable tools that warrant mastery are Power Query and Power Pivot.
Power Query serves as a remarkable asset for effortlessly importing and transforming data, paving the way for seamless analysis. On the other hand, Power Pivot Shines when you’re grappling with substantial volumes of data. This tool is adept at housing massive datasets outside of Excel.
FAQs on Excel Data Analysis Functions
What are Excel data analysis functions?
Excel data analysis Functions are bulti-in formulas and tools that allow you to perform various calculations, manipulations, and visualizations on your data to extract meaningful insights and patterns.
Why data analysis functions are used in Excel?
Data analysis functions empower you to make informed decisions, uncover trends, and draw conclusions from your data. They streamline the process of interpreting information and support effective data-driven decision-making.
What are some common data analysis functions in Excel?
Common Excel data analysis functions include SUM, AVERAGE, COUNT, MIN, MAX, IF, VLOOKUP, HLOOKUP, INDEX, MATCH, and more. These functions help with aggregating data, conditional calculations, searching, and retrieving values.
What is the Data Analysis Toolpak in Excel?
The Data Analysis Toolpak is an add-in that provides advanced statistical, financial, and engineering functions for data analysis. To access it follow the below steps:
Step 1: Go to the “File”.
Step 2: Click on “Options”.
Step 3: Click on “Add-ins” and enable the Toolpak.
Like Article
Suggest improvement
Share your thoughts in the comments
Please Login to comment...