Estimating Limits from Graphs
Last Updated :
01 Aug, 2022
The concept of limits has been around for thousands of years. Earlier mathematicians in ancient civilizations used limits to approximate the area of a circle. But the formal concept was not around till the 19th century. This concept is essential to calculus and serves as a building block for analyzing derivatives, continuity, and differentiability. Intuitively, limits give us an idea about the values function approaches at a particular value of x. Using this idea, limits can also be estimated to a certain extent just by looking at the graph. Let’s look at these ideas in detail.
Limit
The limit of a function at a number x = a can be thought of as the value function starts to take while reaching towards x = a. The point x = a can be approached from either of the sides, the left-hand side or the right-hand side. For example, let’s consider a function f(x), then the limit of the function at x = a is denoted as,

The left-hand limit is denoted as,

Similarly, the right-hand limit is denoted as,

- If f(x) gets closer and closer to a specific value L as x approaches a chosen value c from the right, then it is said that the limit of f(x) as x approaches c from the right is L.
- If f(x) gets closer and closer to a specific value L as x approaches a chosen value c from the left, then it is said that the limit of f(x) as x approaches c from the left is L.
- If the limit of f(x) as x approaches c is the same from both the right and the left, then it is said the limit of f(x) as x approaches c is L.
If f(x) never approaches a specific finite value as x approaches c, then we say that the limit does not exist. If f(x) has different right and left limits, then the two-sided limit ( ) does not exist.
Limits to any function can be calculated through two approaches:
- Algebraic Method
- Graphical Method
Algebraic methods involve manipulating the function such that its limit can be calculated easily. The graphical method simply involves making a graph of the function, and then the limit can be estimated just by looking at the graph.
Estimating Limits from Graphs
Consider the function f(x),
f(x) = 3x + 4
This is an equation of a line. Let’s see what the value of the limit of this function at x = 1 is. The figure below shows the graph for this function,
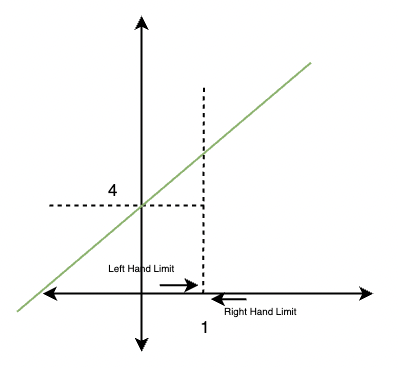
Notice that as we approach from both the left-hand side and right-hand side of x = 1, the function moves toward a single value. This value is called the limit of the function.
Unbounded Limits
Sometimes there are certain kinds of functions that move towards infinity. In such cases, the value of the limit goes up to infinite. For example, for function f(x) given below,
f(x) = 
The limit for this function at x = 0,

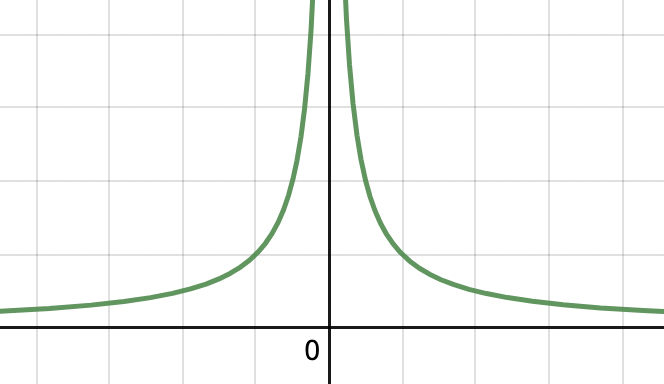
Notice in the figure that the limit at x = 0 is unbounded and is going up to infinity. Such limits are called unbounded limits.
One-Sided Limits
Sometimes functions are not continuous, which means they tell us two different limits while approaching from two different sides. For example, the greatest integer function is inherently discontinuous, and at these discontinuities, we observe two different values.
f(x) =[x]
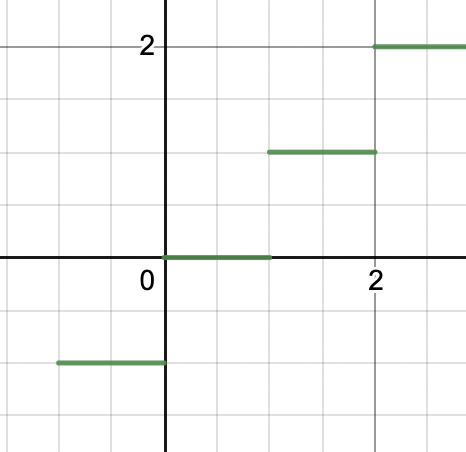
At x = 1, there are two values when approached from two different sides. In such cases, mostly we are asked to tell the value from one side. These are called one-sided limits.
Limits and Graphical Behavior
Limits can tell a lot about a function’s behavior at some particular point. Then how should one use it? In cases where it is known that the function is discontinuous, it becomes hard to analyze the graph of the function solely using derivatives. In such cases, limits can be used to find the values of the function at the points of discontinuities. For example, let’s say we have a function f(x),

It is obvious from the function definition that this function is discontinuous, so derivatives are not useful at such places. Graph shapes for individual pieces are already known. Let’s calculate the value of the function at discontinuity x = 1.
Left-hand Limit at x =1,

Right-hand Limit at x =1,

⇒
⇒ 5
So, the values of both limits are different. Now we can plot the function on a graph.
Solved Questions on Estimating Limits from Graphs
Question 1: Find the 
Answer:
Graph of x2 is an upward parabola which is centered at origin. The figure below shows the graph of the given function.
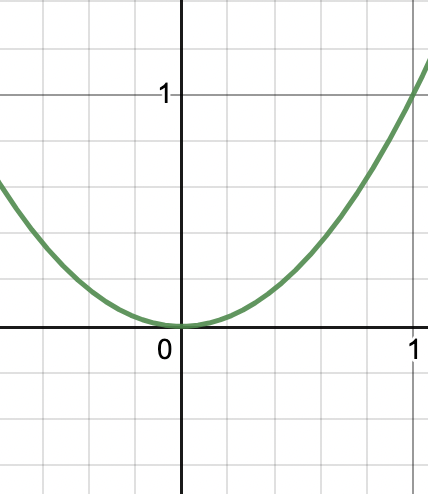
Notice that the function starts moving towards taking a value of 1 as one moves towards the value of x = 1.
Thus, 
Question 2: Find the 
Answer:
Graph of log(x) is a saturating function. The figure below shows the graph of the given function.
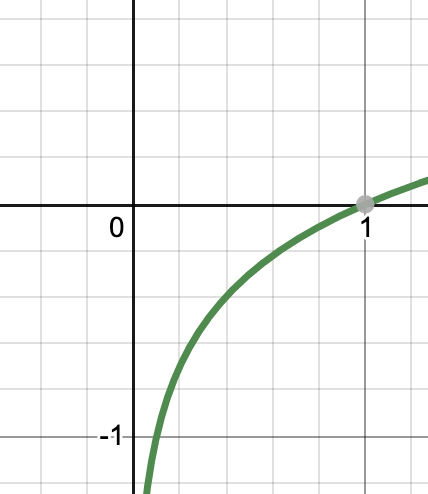
Notice that the function starts moving towards taking a value of -∞ as one moves towards the value of x = 0. This is an example of unbounded limit mentioned above.
Thus, 
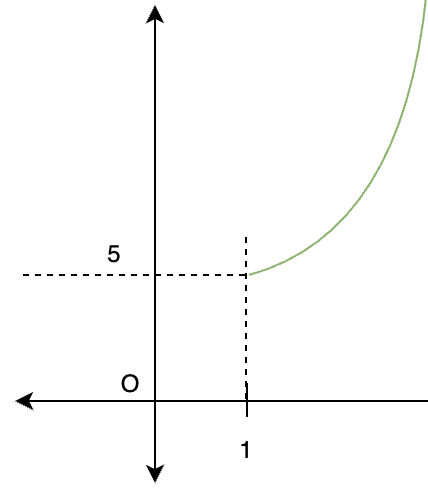
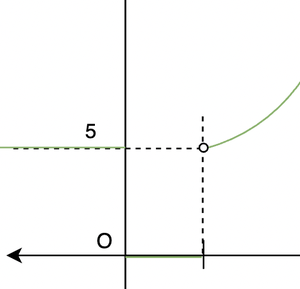
Question 3: Find the limit of the function at x = 1.
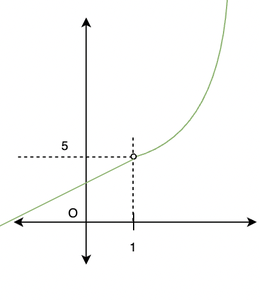
Solution:
In the graph, the white dot at x = 1 indicates that the function is not defined at x = 1. That means, there should be no value of the function at x =1.
Limit allows us to calculate the values the function was approaching had it been defined at x =1.
So, in this case from graph it can be seen that the function is approaching value of 5.

Question 4: Find the value of the limit of the function f(x) = at x = 0.
Solution:
The figure shows the graph for the given function
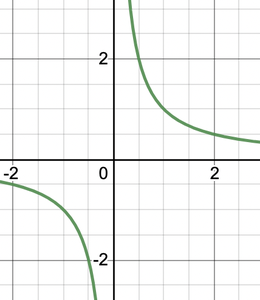
The figure makes it clear that there are two limits depending on from which side we are approaching the function.
Left Hand Side Limit:
While approaching zero from the negative side of the origin takes the function to negative infinity.

Right Hand Side Limit:
While approaching zero from the positive side of the origin takes the function to positive infinity.

Question 5: Find the
Answer:
Graph of x2 is an upward parabola which is centered at origin. The figure below shows the graph of the given function.
Notice that the function starts moving towards taking a value of 1 as one moves towards the value of x = 1.
Thus,
Question 5: Find out the limit at x = 0 for the given function,
Answer:
In the figure, the given function is not continuous at origin. That means there will be two different values of the limit – one from left-hand side and another from right-hand side.
Left- Hand Limit for the function

Right – Hand Limit for the function,

Like Article
Suggest improvement
Share your thoughts in the comments
Please Login to comment...