Drew Conway’s Diagram of Data Science
Last Updated :
22 Jan, 2021
Before jumping into Drew Conway’s Venn Diagram of Data Science the very first question that arises is, “What is Data Science?” Data science intends various things for various people, but in summary, data science is using data to answer questions. This definition is a pretty broad definition, and that’s because one must say data science is a reasonably broad field!
Data science is the science of analyzing raw data using statistics and machine learning techniques with the purpose of drawing conclusions about that information.
So in short it can be stated that Data Science involves:
- Statistics, computer science, mathematics
- Data cleaning and formatting
- Data visualization
So we’ve discussed what data science is and the key pillars of data science, but something else we need to talk about is who precisely a data scientist is? An Economist Special Report says that a data scientist is characterized as someone:
“who combines the skills of software programmer, statistician, and storyteller slash artist to evoke the chunks of gold hidden under mountains of data”
But now the question arises, what skills do a data scientist embody? And to answer this, let’s discuss the popular Venn diagram Drew Conway’s Venn diagram of data science in which data science is the intersection of three sectors – Substantive expertise, hacking skills, and math & statistics knowledge.
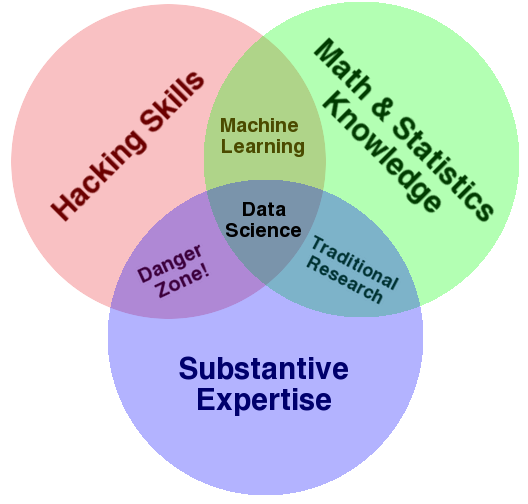
Let’s explain a little what we mean by this Venn diagram, we know that we use data science to answer questions – so first, we need to have enough experience in the area that we desire to ask about in order to express the questions and to understand what kinds of data are relevant to reply that question. Once we have our question and relevant data, we understand from the kinds of data that data science operates with, often times it needs to undergo significant cleaning and formatting – and this often takes computer programming skills. Finally, once we have the data, we require to examine it, and this usually conveys math and stats knowledge.
Explanation of Drew Conway’s Venn Diagram
In Drew Conway’s Venn Diagram of Data Science, the primary colours of data are
- Hacking skills,
- Math and stats knowledge, and
- Substantive expertise
But the question is why has he highlighted these three? So let’s understand the term why!!
- It is known to everyone that data is the key part of data science. And data is a commodity traded electronically; so, in order to be in this market, one needs to speak hacker. So what does this line means? Being able to manage text files at the command-line, learning vectorized operations, thinking algorithmically; are the hacking skills that make for a successful data hacker.
- Once you have collected and cleaned the data, the next step is to actually obtain insight from it. In order to do this, you need to use appropriate mathematical and statistical methods, that demand at least a baseline familiarity with these tools. This is not to say that a PhD in statistics is required to be a skilled data scientist, but it does need understanding what an ordinary least squares regression is and how to explain it.
- The third important part is Substantive expertise. According to Drew Conway, “data plus math and statistics only gets you machine learning”, which is excellent if that is what you are interested in, but not if you are doing data science. Science is about experimentation and building knowledge, which demands some motivating questions about the world and hypotheses that can be brought to data and tested with statistical methods.
- On the other hand, “substantive expertise + knowledge in mathematics and statistics are where maximum traditional researcher falls”. Doctoral level researchers use most of their time getting expertise in these areas, but very little time acquiring technology. Part of this is the culture of academia, which does not compensate researchers for knowing technology.
- Finally, a name on the “hacking skills plus substantive expertise danger zone”. This is where he puts people who, “know enough to be dangerous,” and it is the most questionable area in the diagram. In this zone people who are supremely able of extracting and structuring data, probably associated with a field they know quite a bit about, and probably even know enough R to run a linear regression and report the coefficients; but they require an understanding of what those coefficients mean. It is from this part of the diagram that the phrase “lies, damned lies, and statistics” arises, because either through ignorance or dislike this overlap of skills gives people the ability to create what appears to be a legal analysis without any understanding of how they got there or what they have created. Fortunately, it requires intentional ignorance to obtain hacking skills and substantive expertise without learning some math and statistics along the way.
Like Article
Suggest improvement
Share your thoughts in the comments
Please Login to comment...