Draw Vertical Line to X-Axis of Class Date in ggplot2 Plot in R
Last Updated :
04 Jul, 2021
In this article, we will see how to draw Vertical Line to X-Axis of Class Date in ggplot2 Plot in R programming language. Here we are using Scatter Plot, you can draw any graph as per your requirement.
First, load the ggplot2 package by using the library() function. Now we will create a DataFrame with two vectors for X and Y-Axis respectively. Here use a sequence of dates from starting to the end as a value X-Axis of the plot. For that we have to use R Functions such as “seq()” and “as.Date()”. seq() function generates sequence of dates.
Syntax : seq(…, length, by)
Parameters :
- Generally seq function has many parameters but here we use only required parameters out of these.
- … : arguments passed to be sequenced. here we want to sequence dates. So that we use as.Date() function as a first parameter of seq.
- length : desired length of the sequence. here we want 60 months of dates. So we give the value 60 to length parameter.
- by : increment of sequence. here we give the value ‘1 month’ to by parameter for increment dates by 1 month.
Return : Regular Sequences as per given arguments.
as.Date() function converts objects assigned in it to class “Date” representing calendar dates.
Syntax : as.Date(x, origin)
Parameters :
- x : An object to be converted. this is necessary to assign to as.Date . if we have not any object to be convert, we can use ‘0’ as a value.
- origin : a ‘Date’ object
Return : An object of class ‘Date’
Now To create an R plot, we use ggplot() function and to make it a scatter plot we add geom_point() function to ggplot() function.
Let us first visualize it normally, so that the difference is apparent.
Example:
R
library("ggplot2")
data <- data.frame(X_dates = seq(as.Date(0, origin = "2000-01-01"),
length = 60, by = "1 month"),
Y_Values = sample(1:100, 60, replace = TRUE))
simplePlot <- ggplot(data, aes(X_dates, Y_Values))+
geom_point(fill = "green", size = 5, color = "black", shape = 21)
simplePlot
|
Output:
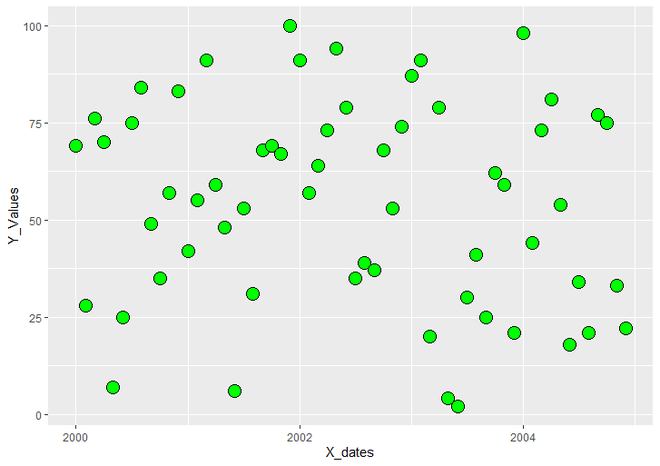
ScatterPlot using ggplot2
Now to draw vertical line to X Axis of Class Date, we have to define range of the dates from which we want to draw vertical lines. For that, we create “date_range” object and assign range of dates to it. Here, we choose range of the dates using as.Date() function and select the dates from X-axis values using which() function. which() function returns the index of the value which satisfies the given condition.
Syntax : which(x)
Parameter :
- which() has mainly has three parameters x, arr,ind and useNames but only ‘x’ is the necessary to use. Here we have not use other two parameters.
- x : An input logical vector or you can say it is a condition by which we want to extract values.
Return : returns the position of the values from the logical vector or condition.
Following is the syntax that is used to assign range of dates.
Syntax:
date_range <- which(data$X_dates %in% as.Date(c(“start_date”, “end_date”)) )
Now for drawing vertical lines to plot, we add geom_vline() function to geom_point() which draws vertical lines on given value of X-Axis. Inside geom_vline(), we use parameter “xintercept” to control the position of line on X Axis. We give numeric value of date range returned by indexing dates to xintercept using as.numeric() function.
Syntax : geom_vline(xintercept)
Parameter : here xintercept is used control the X position of line.
Return : Vertical line on R plot.
Example:
R
library("ggplot2")
data <- data.frame(X_dates = seq(as.Date(0, origin = "2000-01-01"),
length = 60, by = "1 month"),
Y_Values = sample(1:100, 60, replace = TRUE))
date_range <- which(data$X_dates %in% as.Date(
c("2001-12-01", "2003-11-01")) )
vlinedPlot <- ggplot(data, aes(X_dates, Y_Values)) +
geom_point(fill = "green", size = 5, color = "black", shape = 21)+
geom_vline(xintercept = as.numeric(data$X_dates[date_range]),
color = "dark green", size = 2)
vlinedPlot
|
Output:
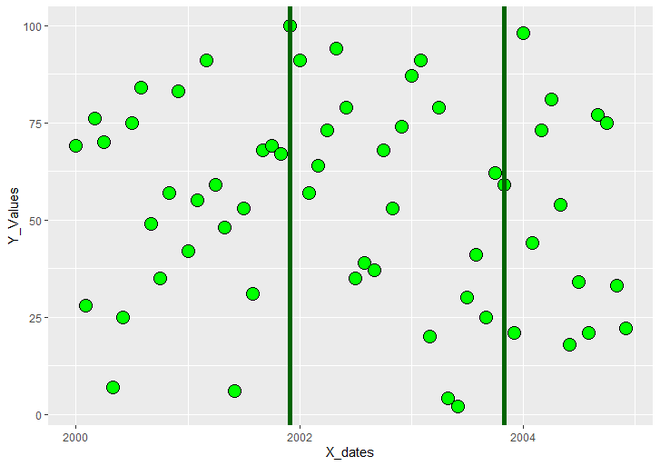
ScatterPlot with Vertical Line to X-Axis of Class Date
Like Article
Suggest improvement
Share your thoughts in the comments
Please Login to comment...