Draw unbalanced grid of ggplot2 Plots in R
Last Updated :
17 Jun, 2021
In this article, we are going to see how to Draw an Unbalanced Grid of ggplot2 plots in R Programming Language. We use mainly grid.arrange() and arrangeGrob() functions. Following is the brief information of these two functions.
- grid.arrange(): It will calculate a different number of rows and columns to organize the plots and for forming nested layouts of plots
Syntax : grid.arrange(plot, nrow, ncol)
Parameter:
- plot: ggplot2 plot which we want to arrange
- nrow: Number of rows
- ncol: Number of columns
Return: Arrangement of plot
- arrangeGrob(): It function takes many parameters eg. layout_matrix, as.table, respect, top, bottom, left, right, and many more.
Syntax : arrangeGrob(…, heights)
Parameter:
- … : ggplot2 plots which we want to arrange on same page
- heights : Heights of those plots
Return: Arrange Multiple Plots on Same Page with different grid
First, we should load some R packages that are going to be in use further in this example. We will use ggplot2 package for draw plot and gridExtra for drawing various grids on plot.
install.packages("ggplot2")
library("ggplot2")
install.packages("gridExtra")
library("gridExtra")
For the Data of Scatter Plot, we pick some 50 random values for the X and Y axis both using rnorm() function which can generate random normal values. Then create a DataFrame and assign it to the ‘data’ data object.
data <- data.frame(x = rnorm(50), y = rnorm(50))
Now we create a Scatter Plot using ggplot() function and make it Scattered using geom_point() function.
Below is the implementation:
R
library("ggplot2")
library("gridExtra")
data <- data.frame(x = rnorm(50), y = rnorm(50))
gplot <- ggplot(data, aes(x, y)) + geom_point(col = "green")
gplot
|
Output:
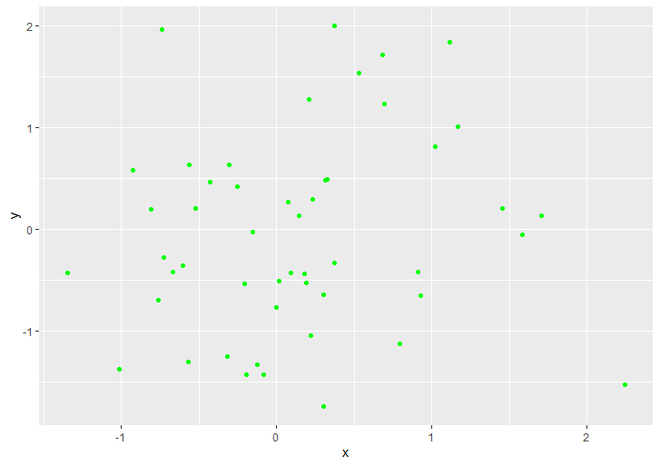
Simple Scatter Plot
Change Vertical Grid of plot
Here we are changing the vertical grid of the plot. We use grid.arrange() function of gridExtra package. Inside grid.arrange() package, we assign gplot (Our Scatter Plot) as a first parameter and ncol as the second parameter. ncol is just divided the plot area vertical in the value which we assign to ncol. Here we change the plot’s vertical grid to half of the plot space using “ncol = 2”.
Code:
R
library("ggplot2")
library("gridExtra")
data <- data.frame(x = rnorm(50), y = rnorm(50))
gplot <- ggplot(data, aes(x, y)) + geom_point(col = "green")
grid.arrange(gplot, ncol = 2)
|
Output:
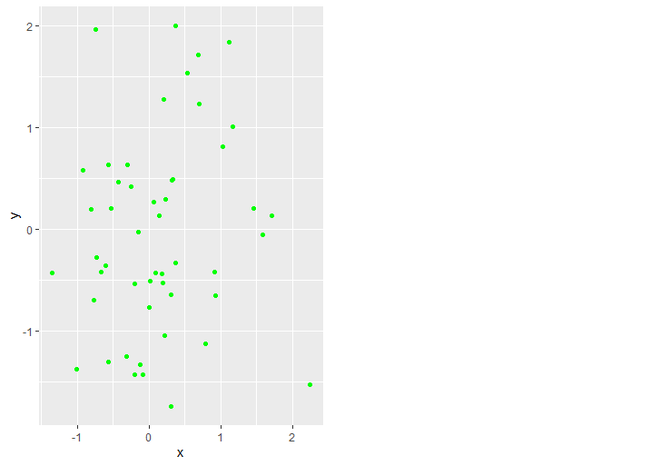
Scatter Plot with half vertical grid
Change Horizontal Grid of Plot
For changing the Horizontal grid of the plot, we simply replace ncol to nrow parameter of grid.arrange() function. nrow parameter takes the value in which we want to divide the plot horizontally. Here we change the plot’s Horizontal grid to half of the plot space using “nrow = 2”.
Code:
R
library("ggplot2")
library("gridExtra")
data <- data.frame(x = rnorm(50), y = rnorm(50))
gplot <- ggplot(data, aes(x, y)) + geom_point(col = "green")
grid.arrange(gplot, nrow = 2)
|
Output:
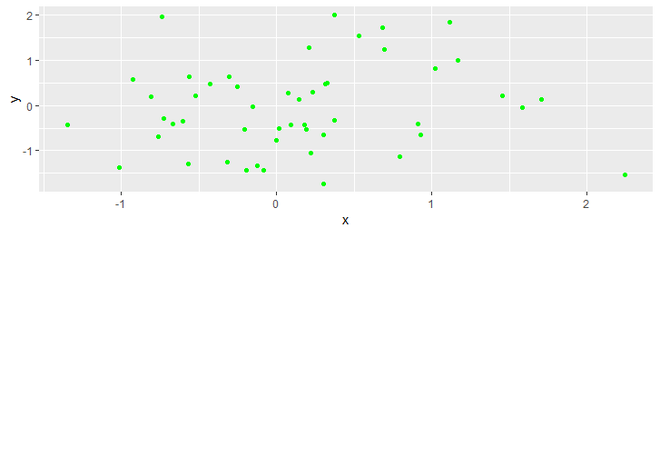
Scatter Plot with half horizontal grid
Draw Multiple plots of different grid size on the same Plot Space
For Draw Multiple plots of different sizes, we use arrangeGrob() as the second parameter of grid.arrange() function which will take the height and width of each graph as an argument. First, it will take gplot as an argument for each graph we want to create, and then it also specifies the heights of each plot using the heights parameter.
Code:
R
library("ggplot2")
library("gridExtra")
data <- data.frame(x = rnorm(50), y = rnorm(50))
gplot <- ggplot(data, aes(x, y)) +
geom_point(col = "green")
grid.arrange(gplot,
arrangeGrob(gplot, gplot,
heights = c(0.4, 0.6)),
ncol = 2)
|
Output:
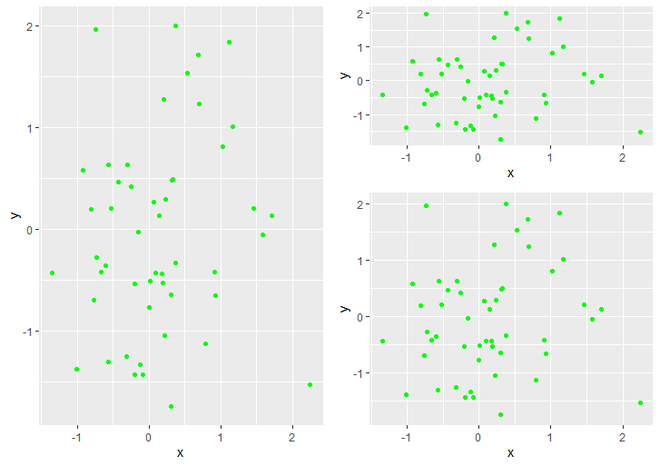
Multiple Plots of different size of grids
Share your thoughts in the comments
Please Login to comment...