Draw Sudan Flag using MATLAB
Last Updated :
14 Mar, 2019
In Digital image processing, a colored image is represented in a 3-Dimensional matrix. Image can be represented in various color models such as RGB (Red, Green, Blue) model, HSV (Hue, Saturation, Value) model, YIQ (Luminance-Inphase Quadrature) model, CMYK (Cyan, Magenta, Yellow, Black) model. Generally, an image is represented in the RGB model. The first channel of the matrix is Red, the second channel is the Green and the third channel is Blue.
Approach to draw Sudan Flag:
- Create a zero matrix of 300X600X3.300 is the number of rows, 600 is the number of columns and 3 represent RGB color channel. Fill the matrix with (255, 255, 255). 255 represent white pixel and 0 represent black pixel.
img(:, :, :)=255
- Fill the matrix with crimson color(210, 16, 42) between rows from 1 to 100 and between columns from 151:600.
- Fill the matrix with black(0, 0, 0) between rows from 200 to 300 and between columns from 151:600.
- After these operations, our image looks like this

- Now, we have to draw one upper triangle and one lower triangle.
- For lower triangle, from row 1 to 150 and column 1 to 150 fill the matrix with green color(0, 114, 14)
- Similarly, for upper triangle, from row 150 to 300 and column 1 to 150 fill the matrix with green color(0, 114, 14)
Implementation is given below:
img=uint8(zeros(300, 600, 3));
img(:, :, :)=255;
img(1:100, 151:600, 1)=210;
img(1:100, 151:600, 2)=16;
img(1:100, 151:600, 3)=42;
img(200:300, 150:600, :)=0;
for i=1:150
for j=1:150
if(j<i)
img(i, j, 1)=0;
img(i, j, 2)=114;
img(i, j, 3)=41;
elseif(i<=100)
img(i, j, 1)=210;
img(i, j, 2)=16;
img(i, j, 3)=42;
end
end
end
for i=150:300
for j=1:150
if(i+j<=300)
img(i, j, 1)=0;
img(i, j, 2)=114;
img(i, j, 3)=41;
elseif(i>=200)
img(i, j, :)=0;
end
end
end
figure, imshow(img);
|
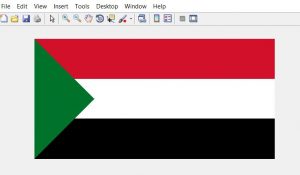
Output :
Like Article
Suggest improvement
Share your thoughts in the comments
Please Login to comment...