Draw Boxplot with Mean in R
Last Updated :
29 Jun, 2021
In this article, we will discuss how to draw a boxplot with the mean in the R programming language.
Method 1: Using points() and text()
In this approach for drawing the boxplot with a mean value of the data on it, the user needs to call the boxplot() function with the required parameters for drawing the simple boxplot of the given data, and with this user needs to call the points() function to point out the mean value of every boxplot plotted and further with the help of the text() function with the required parameters it will be possible to get the mean value on the plot of the boxplot in the R programming language.
- Points(): This is a generic function to draw a sequence of points at the specified coordinates.
Syntax:
points(x, y = NULL, type = “p”, …)
- Text function helps to draw the strings given in the vector labels at the coordinates given by x and y.
Syntax:
text (x, y = NULL, labels = seq_along(x$x), adj = NULL, pos = NULL, offset = 0.5, vfont = NULL, cex = 1, col = NULL, font = NULL, …)
Example:
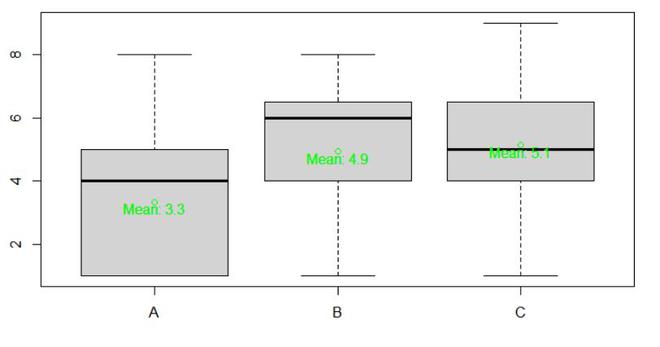
R
gfg=data.frame(A=c(1,5,1,5,6,6,4,1,1,5,4,1,8,1,1),
B=c(1,8,6,6,6,4,5,7,8,1,7,4,4,1,6),
C=c(9,5,1,5,4,1,8,6,4,8,4,4,5,7,6))
gfg_mean=colMeans(gfg)
boxplot(gfg)
points(x = 1:ncol(gfg),y = gfg_mean, col = "green")
text(x = 1:ncol(gfg),y =gfg_mean - 0.20,
labels = paste("Mean:", round(gfg_mean, 1)), col = "green")
|
Output:
Method 2: Using geom_boxplot() and stat_summary() from ggplot2 package
In this approach to drawing the boxplot with the mean, the user first needs to import and install the ggplot2 package to the R console as in this approach the used function is from the ggplot2 package, then the user needs to call the geom_boxplot() function with the required parameters which will lead to the normal plotting of the boxplot of the data provided and then further the user needs to call the stat_summary() which will find the mean of every boxplot and label it on the plot in the R programming language.
geom_boxplot() function is used to plot the Box and whiskers plot.
Syntax:
geom_boxplot( mapping = NULL, data = NULL, stat = “boxplot”, position = “dodge2”, …, outlier.colour = NULL, outlier.color = NULL,outlier.fill = NULL, outlier.shape = 19, outlier.size = 1.5, outlier.stroke = 0.5, outlier.alpha = NULL, notch = FALSE,notchwidth = 0.5, varwidth = FALSE, na.rm = FALSE, orientation = NA, show.legend = NA, inherit.aes = TRUE)
- stat_summary() function allows for tremendous flexibility in the specification of summary functions
Syntax:
stat_summary(mapping = NULL, data = NULL, geom = “pointrange”, position = “identity”, …)
Example:
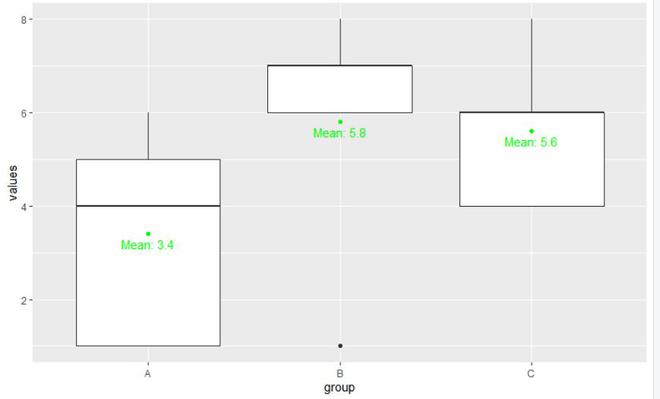
R
library(ggplot2)
gfg=data.frame(values=c(1,8,6,6,6,4,5,7,8,1,7,4,4,1,6),
group =LETTERS[1:3])
ggplot(gfg, aes(x = group, y = values)) + geom_boxplot() +
stat_summary(fun = mean, geom = "point", col = "green") +
stat_summary(fun = mean, geom = "text", col = "green",
vjust = 1.5, aes(label = paste("Mean:", round(..y.., digits = 1))))
|
Output:
Like Article
Suggest improvement
Share your thoughts in the comments
Please Login to comment...