Draw a Quantile-Quantile Plot in R Programming – qqline() Function
Last Updated :
26 Mar, 2024
The Quantile-Quantile Plot in R Programming Language, or (Q-Q Plot) is defined as a value of two variables that are plotted corresponding to each other and check whether the distributions of two variables are similar or not concerning the locations. qqline() function in R Programming Language is used to draw a Q-Q Line Plot.
QQplot in R
Syntax: qqline(x, y, col)
Parameters:
- x, y: X and Y coordinates of plot
- col: It defines color
Returns: A QQ Line plot of the coordinates provided
Implementation of Basic QQplot in R using qqline() Function
R
# Set seed for reproducibility
set.seed(500)

# Create random normally distributed values
x <- rnorm(1200)

# QQplot of normally distributed values
qqnorm(x)

# Add qqline to plot
qqline(x, col = "darkgreen")
Output:
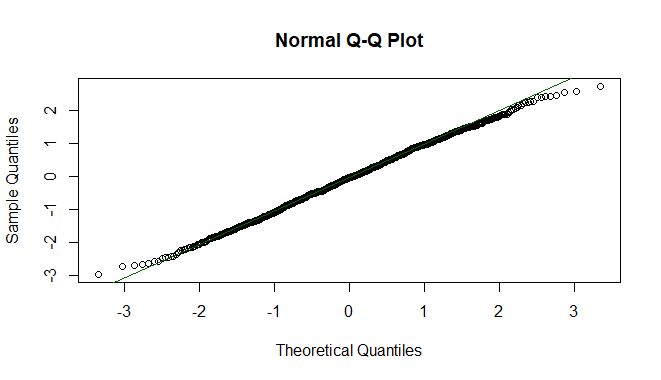
QQplot in R
Above is a representation of QQplot of Normally Distributed Random Numbers.
Implementation of QQplot in R of Logistically Distributed Values
R
# Set seed for reproducibility

# Random values according to logistic distribution
# QQplot of logistic distribution
y <- rlogis(800)

# QQplot of normally distributed values
qqnorm(y)

# Add qqline to plot
qqline(y, col = "darkgreen")
Output:
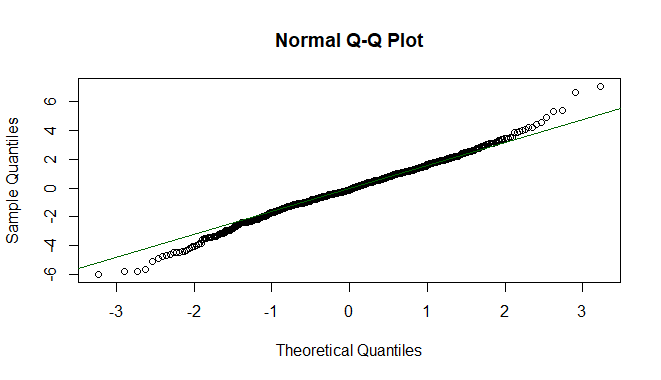
QQplot in R
Above is the Q-Q Plot of theoretical quantiles.
Uniform Distribution of QQplot in R
R
# Set seed for reproducibility
set.seed(500)

# Create a uniform distribution
x_uniform <- runif(1200)

# QQplot of uniform distribution
qqnorm(x_uniform)
qqline(x_uniform, col = "darkgreen")
Output:

QQplot in R
The QQplot in R is a powerful visualization tool in R commonly used to assess whether a given dataset follows a specific theoretical distribution, such as the normal distribution. The QQ plot compares the quantiles of the observed data against the quantiles expected from the theoretical distribution, allowing for a visual inspection of the distributional fit.
Like Article
Suggest improvement
Share your thoughts in the comments
Please Login to comment...