Divide Legend of ggplot2 Plot in R
Last Updated :
29 Jun, 2021
In this article, we will discuss how to divide the legend of ggplot2 plot in the R programming language.
To divide the legend of the ggplot2 plot, the user needs to install and import the gridExtra and cowplot packages in the R console.
- gridExrta package: Provides a number of user-level functions to work with “grid” graphics, notably to arrange multiple grid-based plots on a page, and draw tables.
- cowplot package: The cowplot package is a simple add-on to ggplot. It provides various features that help with creating publication-quality figures, such as a set of themes, functions to align plots and arrange them into complex compound figures, and functions that make it easy to annotate plots and or mix plots with images.
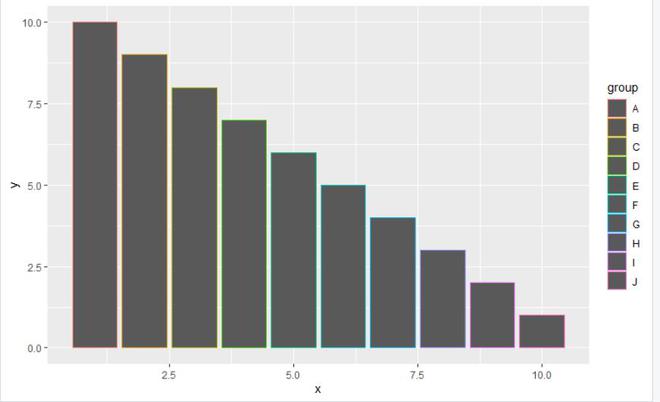
Let us first create a plot with all the legends before dividing them, so that the difference is more apparent.
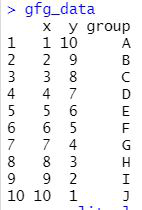
Data in use:
Example:
R
library(ggplot2)
library(gridExtra)
library(cowplot)
gfg_data <- data.frame(x = 1:10, y = 10:1, group = LETTERS[1:10])
ggp_plot<- ggplot(gfg_data, aes(x,y,color = group)) +
geom_bar(stat="identity") +scale_color_manual(values = 1:10) +
labs(color = "Legend-1")
ggp_plot
|
Output:
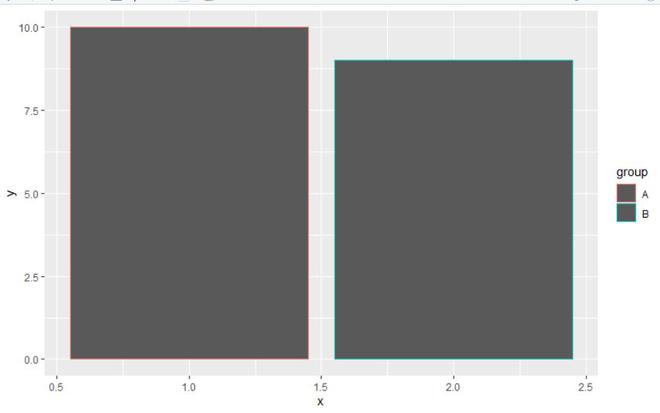
To divide the legends, extract a smaller sample of the data from the dataframe and apply the required functions with proper parameters to generate the desired plot.
Example:
R
library(ggplot2)
library(gridExtra)
library(cowplot)
gfg_data <- data.frame(x = 1:10, y = 10:1, group = LETTERS[1:10])
gfg_split_1 <- gfg_data[gfg_data$group %in% c("A", "B"), ]
gfg_split_1
ggp_split_plot_1 <- ggplot(gfg_split_1, aes(x,y,color = group)) +
geom_bar(stat="identity")+scale_color_manual(values = 1:2) +
labs(color = "Legend-1")
ggp_split_plot_1
|
Output:
Example:
R
library(ggplot2)
library(gridExtra)
library(cowplot)
gfg_data <- data.frame(x = 1:10, y = 10:1, group = LETTERS[1:10])
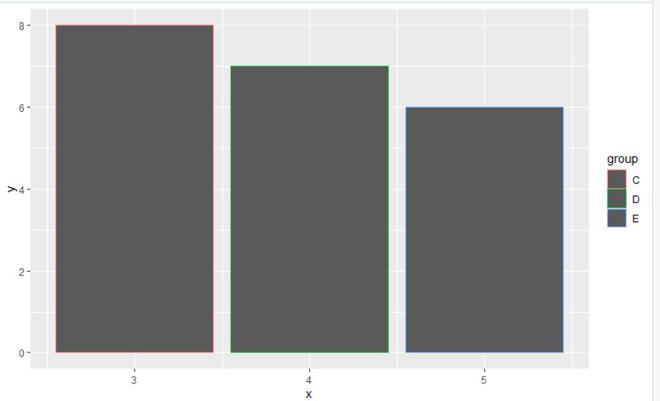
gfg_split_2 <- gfg_data[gfg_data$group %in% c("C", "D","E"), ]
gfg_split_2
ggp_split_plot_2 <- ggplot(gfg_split_2, aes(x,y,color = group)) +
geom_bar(stat="identity")+
scale_color_manual(values = 1:3) +labs(color = "Legend-1")
ggp_split_plot_2
|
Output:
Example:
R
library(ggplot2)
library(gridExtra)
library(cowplot)
gfg_data <- data.frame(x = 1:10, y = 10:1, group = LETTERS[1:10])
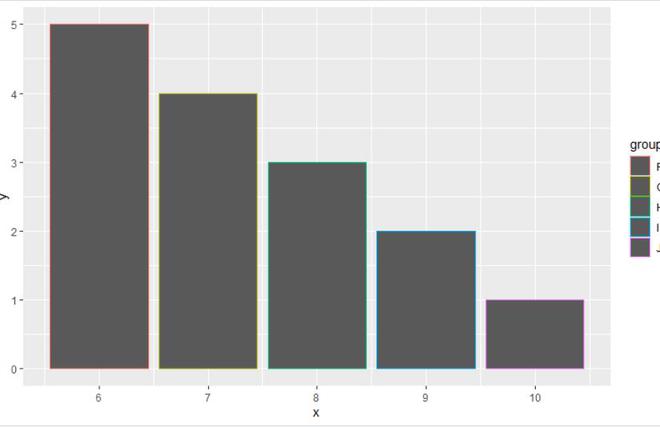
gfg_split_3 <- gfg_data[! gfg_data$group %in% c("A","B","C", "D","E"), ]
gfg_split_3
ggp_split_plot_3 <- ggplot(gfg_split_3, aes(x,y,color = group)) +
geom_bar(stat="identity")+scale_color_manual(values = 1:5) +
labs(color = "Legend-1")
ggp_split_plot_3
|
Output:
Like Article
Suggest improvement
Share your thoughts in the comments
Please Login to comment...