Display the Pandas DataFrame in table style
Last Updated :
29 Sep, 2023
In this article, we’ll see how we can display a DataFrame in the form of a table with borders around rows and columns. It’s necessary to display the DataFrame in the form of a table as it helps in proper and easy visualization of the data. Now, let’s look at a few ways with the help of examples in which we can achieve this.
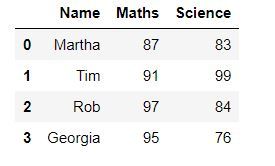
Example 1: One way to display a dataframe in the form of a table is by using the display() function of IPython.display.
Python3
from IPython.display import display
import pandas as pd
dict = {'Name' : ['Martha', 'Tim', 'Rob', 'Georgia'],
'Maths' : [87, 91, 97, 95],
'Science' : [83, 99, 84, 76]}
df = pd.DataFrame(dict)
display(df)
|
Output :
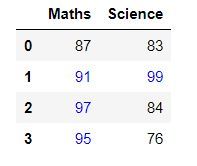
Example 2: In this example we’ll use DataFrame.style. It returns a Styler object, which has useful methods for formatting and displaying DataFrames.
Python3
import pandas as pd
dict = {'Name' : ['Martha', 'Tim', 'Rob', 'Georgia'],
'Maths' : [87, 91, 97, 95],
'Science' : [83, 99, 84, 76]}
df = pd.DataFrame(dict)
df.style
|
Output :
Example 3 : Using DataFrame.style we can also add different styles to our dataframe table. Like, in this example we’ll display all the values greater than 90 using the blue colour and rest with black. To achieve this we’ll use DataFrame.style.applymap() to traverse through all the values of the table and apply the style.
Python3
import pandas as pd
import numpy as np
def color_negative_red(val):
color = 'blue' if val > 90 else 'black'
return 'color: % s' % color
dict = {'Maths' : [87, 91, 97, 95],
'Science' : [83, 99, 84, 76]}
df = pd.DataFrame(dict)
df.style.applymap(color_negative_red)
|
Output :
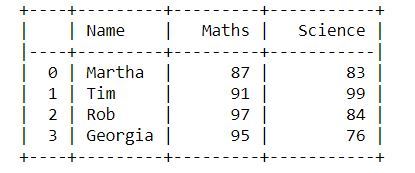
Example 4 : We can also use a library called tabulate for this purpose. It is a library which contains different styles in which dataframes can be displayed. In this example we’ll use the "psql" style.
Python3
from tabulate import tabulate
import pandas as pd
dict = {'Name':['Martha', 'Tim', 'Rob', 'Georgia'],
'Maths':[87, 91, 97, 95],
'Science':[83, 99, 84, 76]}
df = pd.DataFrame(dict)
print(tabulate(df, headers = 'keys', tablefmt = 'psql'))
|
Output :
Below are all the styles that you can use :
- “plain”
- “simple”
- “github”
- “grid”
- “fancy_grid”
- “pipe”
- “orgtbl”
- “jira”
- “presto”
- “pretty”
- “psql”
- “rst”
- “mediawiki”
- “moinmoin”
- “youtrack”
- “html”
- “latex”
- “latex_raw”
- “latex_booktabs”
- “textile”
Like Article
Suggest improvement
Share your thoughts in the comments
Please Login to comment...