Display All X-Axis Labels of Barplot in R
Last Updated :
09 May, 2021
While working on bar plots, there might be a situation where all the labels in the X-axis might not be visible due to the length of the variable names. This article deals with resolving the problem in the R programming language.
In R language barplot() function is used to create a barplot. It takes the x and y-axis as required parameters and plots a barplot. To display all the labels, we need to rotate the axis, and we do it using the las parameter. To rotate the label perpendicular to the axis we set the value of las as 2, and for horizontal rotation, we set the value as 1. Secondly, to increase the font size of the labels we use cex.names to set the font size of the labels.
Syntax: barplot(data, xlab, ylab)
Parameter:
data is the data vector to be represented on y-axis
xlab is the label given to x-axis
ylab is the label given to y-axis
Example:
R
rm(list = ls())
data <- data.frame(value = c(10,20,30,40,50,60,70,80,90),
group = paste0("100_", 1:9))
barplot(data$value ~ data$group)
barplot(data$value ~ data$group,
las = 2,
cex.names = 1)
|
Output:

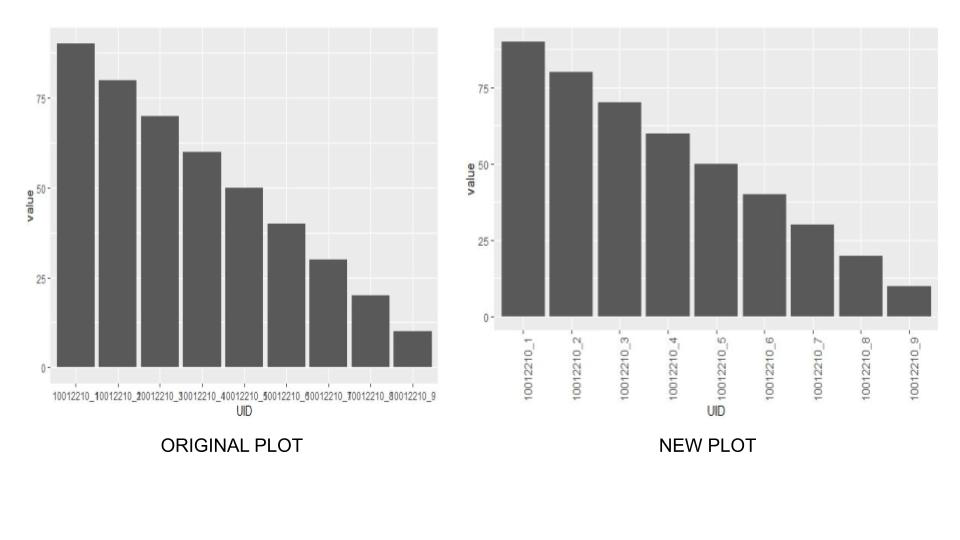
Method 2: Using ggplot
Another most popular library for drawing plots in R is ggplot2. We draw box plots using geom_bar() functions in ggplot2. To specify the changes are for the x-axis we use axis.text.x parameter in theme() function and use element_text() to specify the angle and font size.
Example:
R
rm(list = ls())
library("ggplot2")
data <- data.frame(value = c(90,80,70,60,50,40,30,20,10),
UID = paste0("10012210_", 1:9))
head(data)
ggplot(data, aes(UID, value)) +
geom_bar(stat = "identity")
ggplot(data, aes(UID, value)) +
geom_bar(stat = "identity") +
theme(axis.text.x = element_text(angle = 90, size = 10))
|
Output:
Like Article
Suggest improvement
Share your thoughts in the comments
Please Login to comment...