Dex Youden Plot
Last Updated :
09 Mar, 2021
Prerequisite: Youden Plot
The Dex (Design of Experiments) Youden plot is a special type of Youden plot that can be used for the analysis of full and fractional factorial designs. Before getting in-depth with the Dex Youden plot, let us first understand what a full and a fractional factorial design actually mean.
Full factorial design
In any experimental design, all of its input parameters are set at 2 levels, High (+) and Low (-). An experiment in which all the combinations of levels for each input parameter are taken into consideration is known as a Full factorial design. ( i.e. for x-factors in an experiment, 2x combinations are considered leading to 2x iterations of the experiment.
For example, if the number of factors in an experiment is 2, then 4 iterations of that experiment will take place. ( [++], [–], [+-], [-+] )
Fractional factorial design
Taking all combinations (2x) into consideration becomes a hefty task even for a few input factors (x). The fractional factorial design aims at considering only a fraction of the iterations in the experiment that are important to us. Generally, we consider iterations at 1/2th, 1/4th fraction and so on. (There are better ways for making appropriate selections as well.)
Dex Youden Plot
A Dex Youden plot is a plot of the mean of the response variable for a high level of a factor against the mean of the response variable for the low level of that same factor. It only deals with “-1” and “+1” points and can be used to help determine the best model containing only important factors responsible to find the desired output. [See Fig 1]
Structure
X-axis: Mean of the output Y for low level (-) factor values (Xi).
Y-axis: Mean of the output Y for high level (+) factor values(Xi).
Steps involved in the construction of the plot
Step 1 - For a given factor, calculate the mean of Y for the low and the
         high levels of that factor.
Step 2 - Plot the output value Y w.r.t factor X such that its y coordinate
         corresponds to the high level and x coordinate to the low level of
         output for that particular factor X.
Step 3 - Repeat Steps 1 and 2 for each factor involved in the experiment.
Intuition:
The main objective of the Dex Youden plot is the segregation of the input parameters into 2 categories: Important and Unimportant based on which they are either added or discarded from the final model.
A factor is considered to be important if the output value corresponding to the high and low-level values are different making them far apart from each other in the Dex Youden plot.
A factor is considered to be unimportant if the output value corresponding to the high and low-level factors are equal or similar making them cluster closer to each other.
Consider the following Dex Youden plot with 5 factors (X1, X2, …, X5) taken from an experiment. [Fig 1]
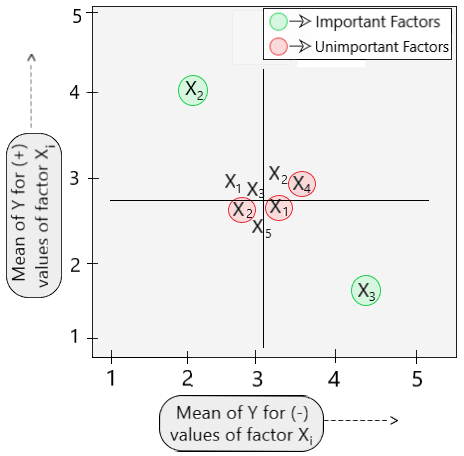
Fig 1: Dex Youden Plot
On seeing the Dex Youden plot, we can say with certainty that factors X2 and X3 are important or are relevant when finding the output Y as they are situated far apart, while the other factors (X1, X4, X5) are unimportant as they are clustered closely.
Dex Youden Plots is a powerful graphical technique that is highly used while performing experiments involving multiple independent factors. The plots help in the elimination of less relevant factors that do not contribute much to finding the desired output while retaining the important ones. For any doubt/query, comment below.
Like Article
Suggest improvement
Share your thoughts in the comments
Please Login to comment...