Descriptive Statistics in Julia
Last Updated :
12 Oct, 2020
Julia is an appropriate programming language to perform data analysis. It has various built-in statistical functions and packages to support descriptive statistics. Descriptive Statistics helps in understanding the characteristics of the given data and to obtain a quick summary of it.
Packages required for performing Descriptive Statistics in Julia:
- Distributions.jl: It provides a large collection of probabilistic distributions and related functions such as sampling, moments, entropy, probability density, logarithm, maximum likelihood estimation, distribution composition, etc.
- StatsBase.jl: It provides basic support for statistics. It consists of various statistics-related functions, such as scalar statistics, high-order moment computation, counting, ranking, covariances, sampling, and empirical density estimation.
- CSV.jl: It is used reading and writing Comma Separated Values(CSV) files.
- Dataframes.jl: It is used for the creation of different data structures.
- StatsPlots.jl: It is used to represent various statistical plots.
Steps to perform Descriptive Statistics in Julia:
Step 1: Installing Required Packages
The following command can be used to install the required packages:
Using Pkg
Pkg.add(“Distributions”)
Pkg.add(“StatsBase”)
Pkg.add(“CSV”)
Pkg.add(“Dataframes”)
Pkg.add(“StatsPlots”)
Step 2: Importing the Required Packages
Julia
using Distributions
using StatsBase
using CSV
using DataFrames
using StatsPlots
|
Step 3: Creating stimulated Data (Random Variables)
Let’s create various variables with random data values
Example:
Julia
using Distributions
using StatsBase
using CSV
using DataFrames
using StatsPlots
Age = rand(10:95, 100);
BloodGrp = rand(["A", "B", "O", "AB"], 100);
|
Step 4: Performing Descriptive statistics
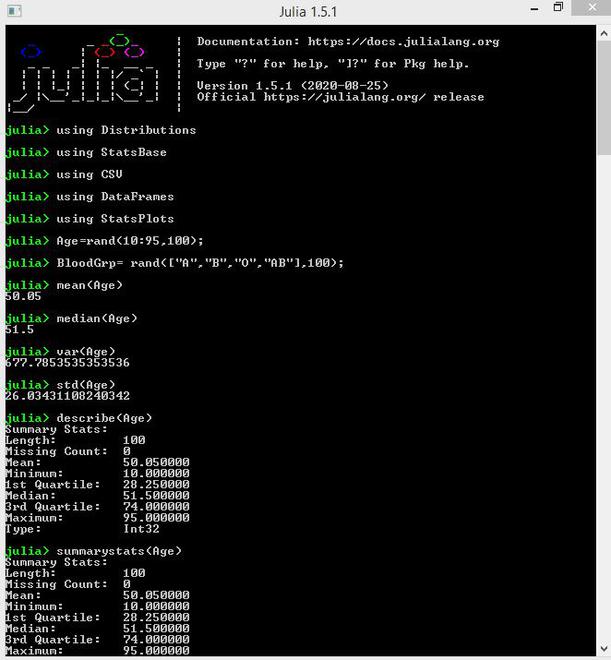
The common statistical functions in Julia include mean(), median(), var(), and std() for calculating mean, median, variance and standard deviation of the data respectively. The more convenient functions aredescribe(), summarystats() from StatsBase package to perform descriptive statistics.
Example:
Julia
using Distributions
using StatsBase
using CSV
using DataFrames
using StatsPlots
Age = rand(10:95, 100);
BloodGrp = rand(["A", "B", "O", "AB"], 100);
mean(Age)
median(Age)
var(Age)
std(Age)
describe(Age)
summarystats(Age)
|
Output:
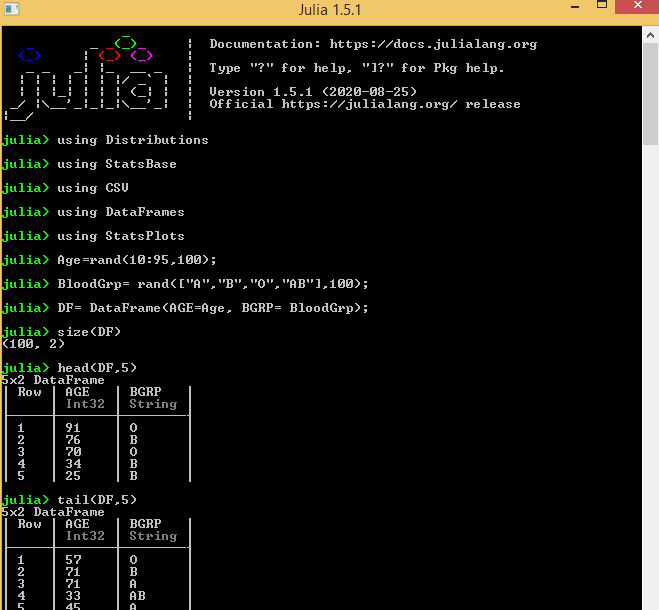
Step 5: Creating data frames from the stimulated data
Stimulated data should be stored in data frame objects for performing manipulation operations easily.
Example:
Julia
using Distributions
using StatsBase
using CSV
using DataFrames
using StatsPlots
Age = rand(10:95, 100);
BloodGrp = rand(["A", "B", "O", "AB"], 100);
DF = DataFrame(AGE = Age, BGRP = BloodGrp);
size(DF)
head(DF, 5)
tail(DF, 5)
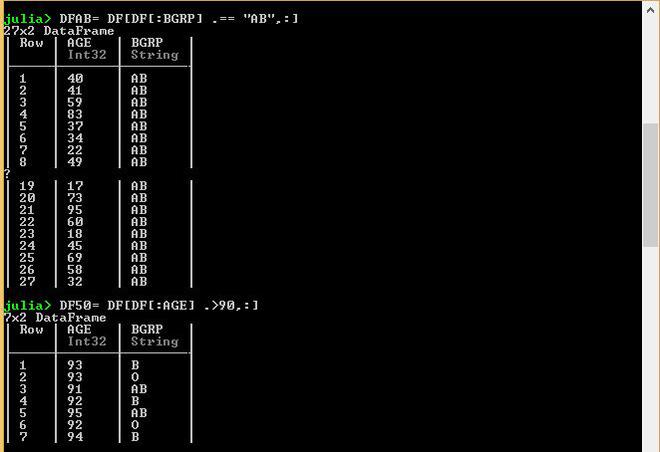
DFAB = DF[DF[:BGRP] .=="AB", :]
DF50 = DF[DF[:AGE] .>90, :]
|
Output:
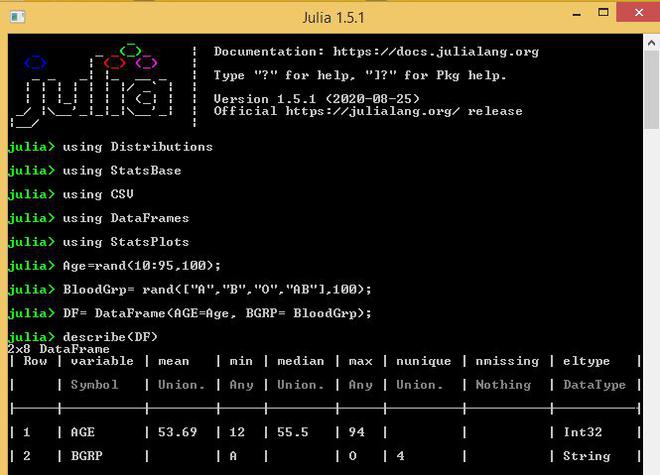
Step 6: Descriptive Statistics using DataFrame Objects
- describe() function can be used to perform descriptive statistics of the data objects.
Example:
Julia
using Distributions
using StatsBase
using CSV
using DataFrames
using StatsPlots
Age = rand(10:95, 100);
BloodGrp = rand(["A", "B", "O", "AB"], 100);
DF = DataFrame(AGE = Age, BGRP = BloodGrp);
describe(DF)
|
Output:
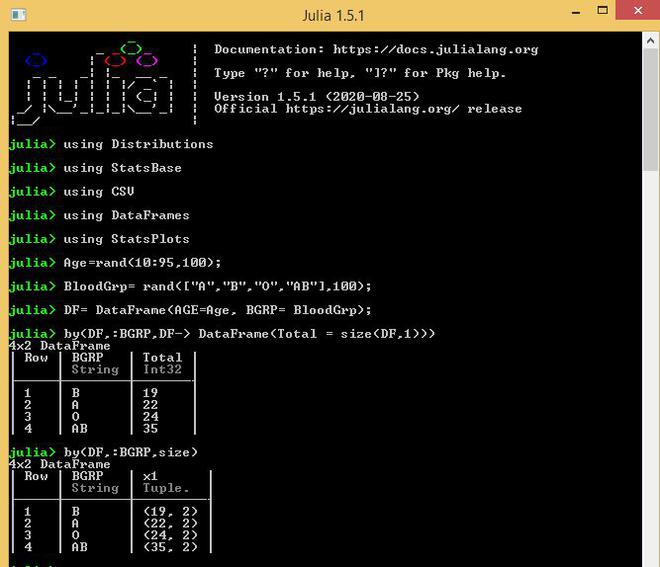
- by() function is used to calculate the number of elements in the sample space of a categorical variable.
Example:
Julia
using Distributions
using StatsBase
using CSV
using DataFrames
using StatsPlots
Age = rand(10:95, 100);
BloodGrp = rand(["A", "B", "O", "AB"], 100);
DF = DataFrame(AGE = Age, BGRP = BloodGrp);
by(DF, :BGRP, DF-> DataFrame(Total = size(DF, 1)))
by(DF, :BGRP, size)
|
Output:
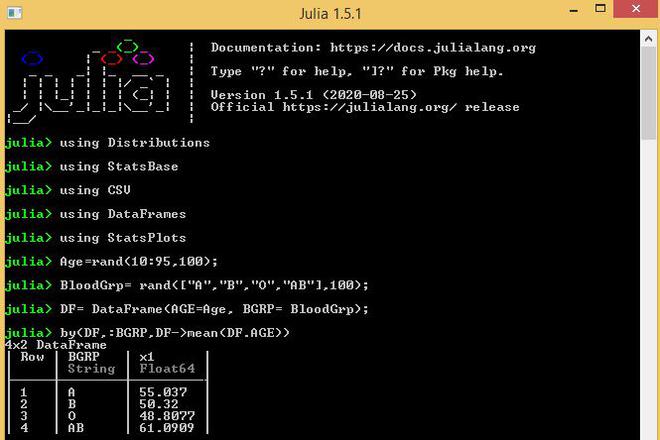
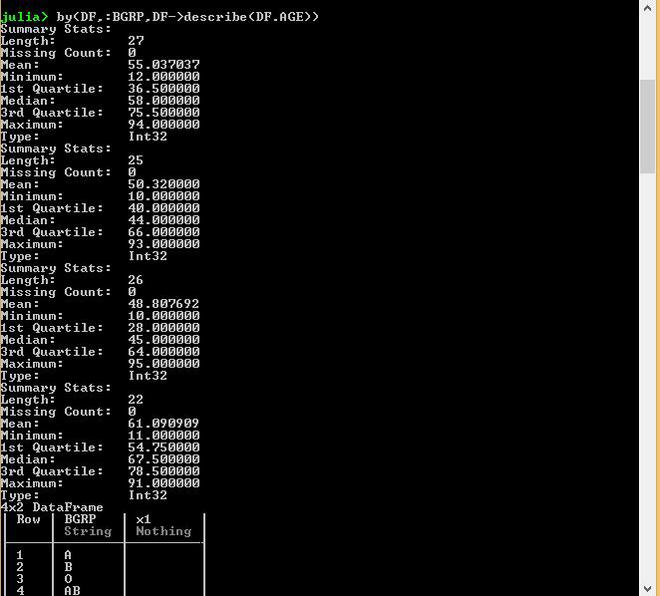
- The descriptive statistics of different numerical variables can be calculated after separating them by categorical variables.
Example:
Julia
using Distributions
using StatsBase
using CSV
using DataFrames
using StatsPlots
Age = rand(10:95, 100);
BloodGrp = rand(["A", "B", "O", "AB"], 100);
DF = DataFrame(AGE = Age, BGRP = BloodGrp);
by(DF, :BGRP, DF->mean(DF.AGE))
by(DF, :BGRP, DF->describe(DF.AGE))
|
Output:
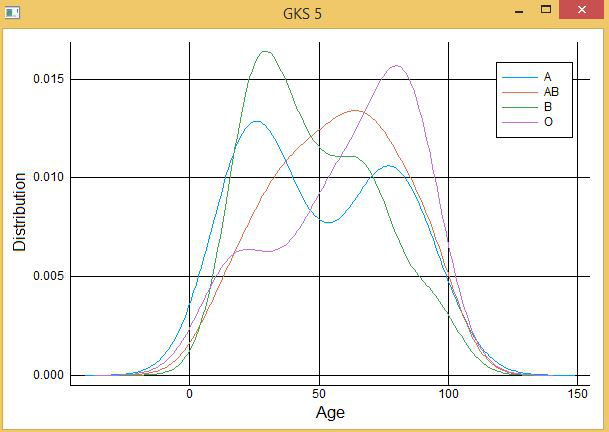
Step 7: Visualizing Data using Plots
DataFrames package works well with the Plots package using the macro functions. In the following code:
- Let’s analyze the Age distribution of the Blood groups A, B, AB, O:
Example:
Julia
using Distributions
using StatsBase
using CSV
using DataFrames
using StatsPlots
Age = rand(10:95, 100);
BloodGrp = rand(["A", "B", "O", "AB"], 100);
DF = DataFrame(AGE = Age, BGRP = BloodGrp);
@df DF density(
:AGE,
group = :BGRP,
xlab = "Age",
ylab = "Distribution"
)
|
Output:
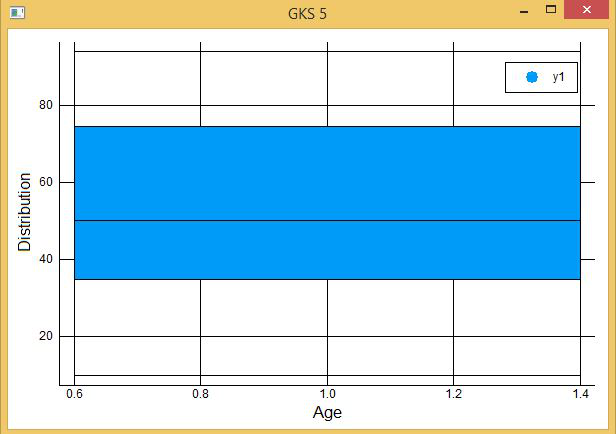
- Let’s create a box-and-Whisker plot of Age :
Example:
Julia
using Distributions
using StatsBase
using CSV
using DataFrames
using StatsPlots
Age = rand(10:95, 100);
BloodGrp = rand(["A", "B", "O", "AB"], 100);
DF = DataFrame(AGE = Age, BGRP = BloodGrp);
@df DF boxplot(
:AGE,
xlab = ”Age”,
ylab = ”Distribution”
)
|
Output:
Like Article
Suggest improvement
Share your thoughts in the comments
Please Login to comment...