Debugging Python code using breakpoint() and pdb
Last Updated :
15 Jun, 2023
While developing an application or exploring some features of a language, one might need to debug the code anytime. Therefore, having an idea of debugging the code is quite necessary. Let’s see some basics of debugging using the built-in breakpoint() function and pdb module.
Python breakpoint()
We know that a debugger plays an important role when we want to find a bug in a particular line of code. Here, Python comes with the latest built-in function breakpoint() which does the same thing as pdb.set_trace() in Python 3.6 and below versions. Debugger finds the bug in the code line by line where we add the breakpoint, if a bug is found then the program stops temporarily then you can remove the error and start to execute the code again.
Syntax in Python 3.7
breakpoint()
Syntax in Python 3.6 and below
import pdb; pdb.set_trace()
Debugging Python code using breakpoint() and pdb Methods
Debugging in Python using breakpoint() and pdb module requires a set of commands that needs to be followed while debugging Python code. These commands are as follows:
c: continue execution
q: quit the debugger/execution
n: step to next line within the same function
s: step to next line in this function or a called function
Here are the examples by which we can debug Python code using breakpoint() and pdb.
Debugging code using the breakpoint() function in Python
In this method, we simply introduce the breakpoint where we have doubts or somewhere we want to check for bugs or errors. We created a function to divide two numbers and added a breakpoint() function just after the function declaration. When we execute the code, it will work until a breakpoint() is found. Then we type the ‘c’ command which indicates ‘continue’.
Python3
def debugger(a, b):
breakpoint()
result = a / b
return result
print(debugger(5, 0))
|
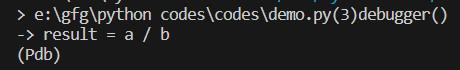
Output:

Debugging with breakpoint() function in Python
In order to move further with the debugging, just type the continue “c” command and press enter.
.JPG)
Using “c” command to continue debugging using Python breakpoint() function
Debugging code using pdb module in Python
As the same suggests, PDB means Python debugger. To use the PDB in the program we have to use one of its methods named set_trace(). Although this will result in the same as the above method, this is another way to introduce the debugger in Python version 3.6 and below.
Example 1: In this example, we are using the pdb module to debug a code with a ‘division by zero’ error.
Python3
def debugger(a, b):
import pdb; pdb.set_trace()
result = a / b
return result
print(debugger(5, 0))
|
Output:
Debugging with pdb module in Python
In order to move further with the debugging, just type the continue “c” command and press enter.

Using “c” command to continue debugging using Python pdb module
Example 2: In this example, we are using the pdb module to debug a code with a ‘list index out of range’ error.
Python3
import pdb;
def debugger(a):
pdb.set_trace()
result = [a[element] for element in range(0, len(a)+5)]
return result
print(debugger([1, 2, 3]))
|
Output:
.JPG)
Debugging with pdb module in Python
In order to move further with the debugging, just type the continue “c” command and press enter.
-min.JPG)
Using “c” command to continue debugging using Python pdb module
Like Article
Suggest improvement
Share your thoughts in the comments
Please Login to comment...