The PDB module in Python gives us gigantic highlights for compelling debugging of Python code. This incorporates:
- Pausing of the program
- Looking at the execution of each line of code
- Checking the values of variables
This module is already installed with installing of python. So, we only need to import it into our code to use its functionality. Before that we must know some concepts which are mentioned below:
- To import we simply use import pdb in our code.
- For debugging, we will use pdb.set_trace() method. Now, in Python 3.7 breakpoint() method is also available for this.
- We run this on Python idle terminal (you can use any ide terminal to run).
Let’s begin with a simple example consisting of some lines of code.
Example:
Python3
import pdb
def fxn(n):
for i in range(n):
print("Hello! ", i+1)
pdb.set_trace()
fxn(5)
|
Output:
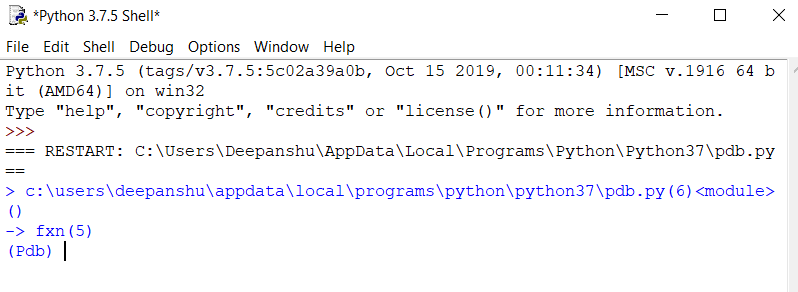
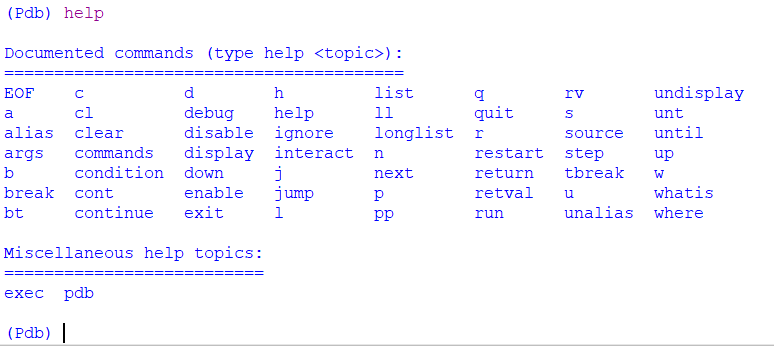
Here, we can see that when the function call is done then pdb executes and ask for the next command. We can use some commands here like
c -> continue execution
q -> quit the debugger/execution
n -> step to next line within the same function
s -> step to next line in this function or a called function
To know more about different commands you can type help and get the required information.
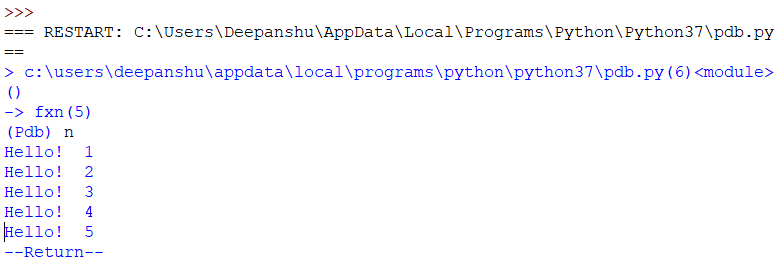
Now, we will execute our program further with the help of the n command.
In a similar way, we can use the breakpoint() method (which doesn’t need to import pdb).
Python3
def fxn(n):
for i in range(n):
print("Hello! ", i+1)
breakpoint()
fxn(5)
|
Output:
Features provided by PDB Debugging
1. Printing Variables or expressions
When utilizing the print order p, you’re passing an articulation to be assessed by Python. On the off chance that you pass a variable name, pdb prints its present worth. Notwithstanding, you can do considerably more to examine the condition of your running application.
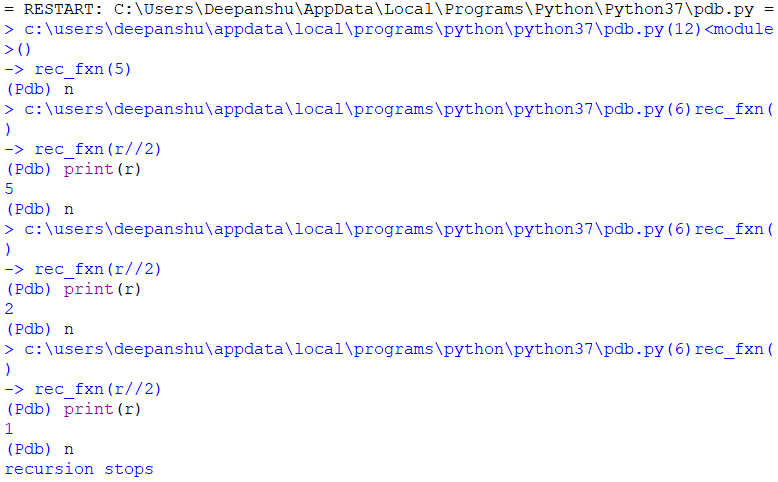
An application of PDB debugging in the recursion to check variables
In this example, we will define a recursive function with pdb trace and check the values of variables at each recursive call. To the print the value of variable, we will use a simple print keyword with the variable name.
Python3
import pdb
def rec_fxn(r):
if r > 0:
pdb.set_trace()
rec_fxn(r//2)
else:
print("recursion stops")
return
pdb.set_trace()
rec_fxn(5)
|
Output:
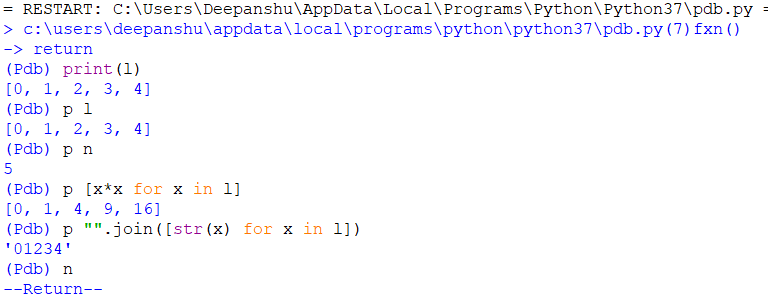
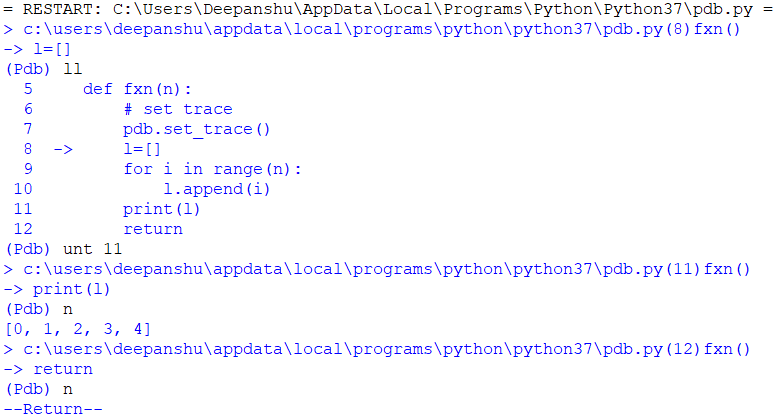
An Example to check expressions
This example is similar to the above example, that prints the values of expressions after their evaluation.
Python3
import pdb
def fxn(n):
l=[]
for i in range(n):
l.append(i)
pdb.set_trace()
return
fxn(5)
|
Output:
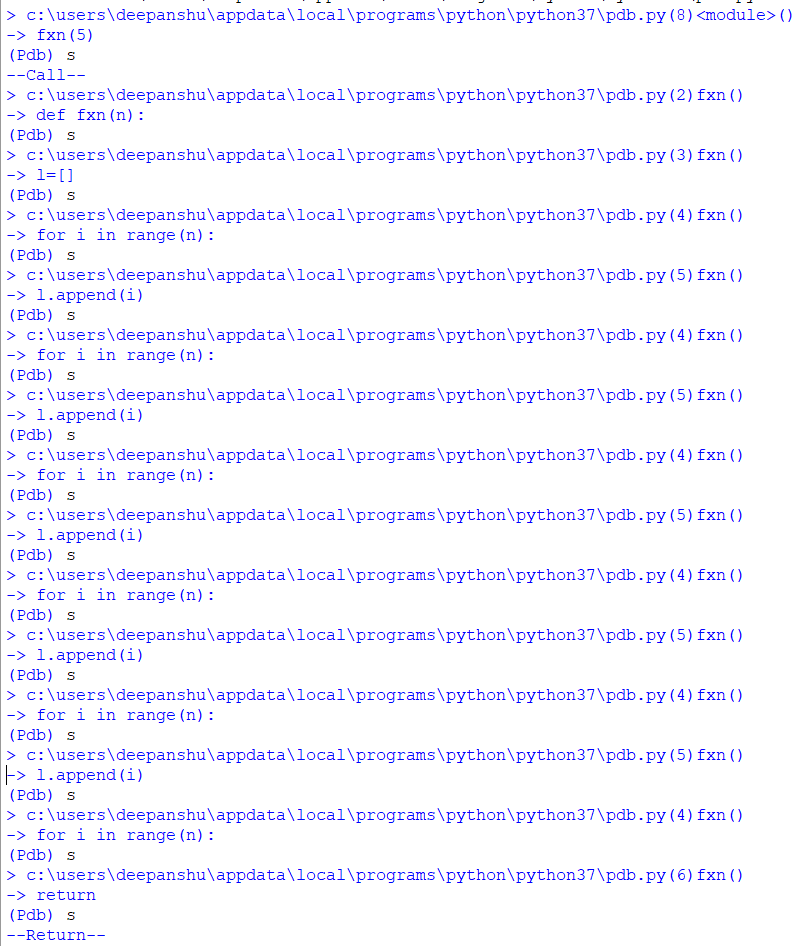
2. Moving in code by steps
This is the most important feature provided by pdb. The two main commands are used for this which are given below:
n -> step to next line within the same function
s -> step to next line in this function or a called function
Let’s understand the working of these with the help of an example.
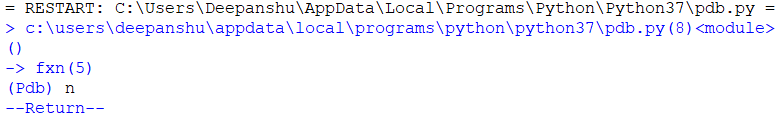
Python3
import pdb
def fxn(n):
l = []
for i in range(n):
l.append(i)
return
pdb.set_trace()
fxn(5)
|
Output Using n:
Output Using s:
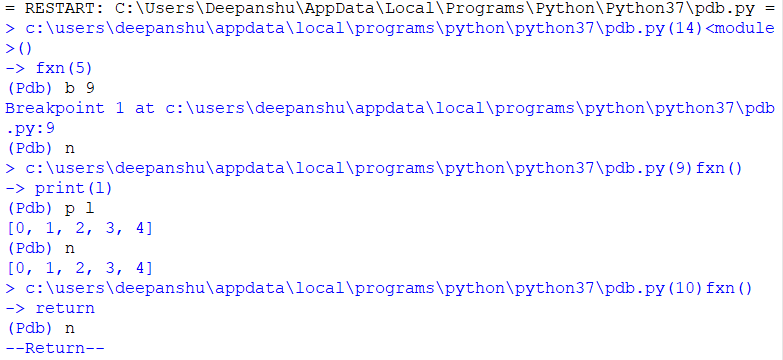
3. Using Breakpoints
This feature helps us to create breakpoints dynamically at a particular line in the source code. Here, in this example, we are creating breakpoint using command b which given below:
b(reak) [ ([filename:]lineno | function) [, condition] ]
        Without argument, list all breaks.
With a line number argument, set a break at this line in the current file. With a function name, set a break at the first executable line of that function. If a second argument is present, it is a string specifying an expression that must evaluate to true before the breakpoint is honored.
The line number may be prefixed with a filename and a colon, to specify a breakpoint in another file (probably one that hasn’t been loaded yet). The file is searched for on sys.path; the .py suffix may be omitted.
Python3
import pdb
def fxn(n):
l = []
for i in range(n):
l.append(i)
print(l)
return
pdb.set_trace()
fxn(5)
|
Output:
4. Execute code until the specified line
Use unt to proceed with execution like c, however, stop at the following line more noteworthy than the current line. Now and then unt is more helpful and faster to utilize and is actually what you need.
unt(il) [lineno]
Without argument, continue execution until the line with a number greater than the current one is reached. With a line number, continue execution until a line with a number greater or equal to that is reached. In both cases, also stop when the current frame returns.
Python3
import pdb
def fxn(n):
pdb.set_trace()
l = []
for i in range(n):
l.append(i)
print(l)
return
fxn(5)
|
Output:
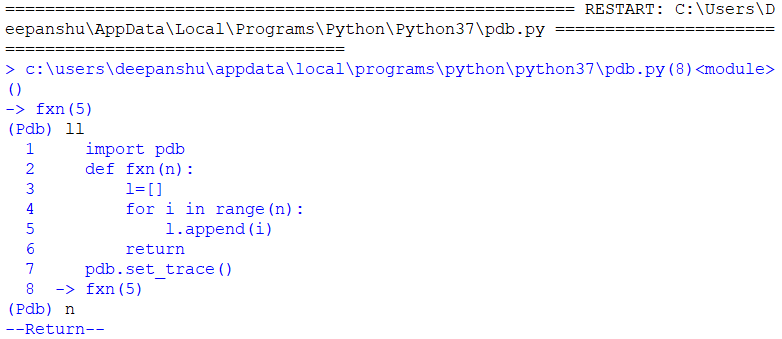
5. List the code
Listing Source code is another feature that can be used to track the code with a line number as a list. For this ll command is used.
longlist | ll -> List the whole source code for the current function or frame.
Let’s understand the working of longlist with the help of an example.
Python3
import pdb
def fxn(n):
l=[]
for i in range(n):
l.append(i)
return
pdb.set_trace()
fxn(5)
|
Output:
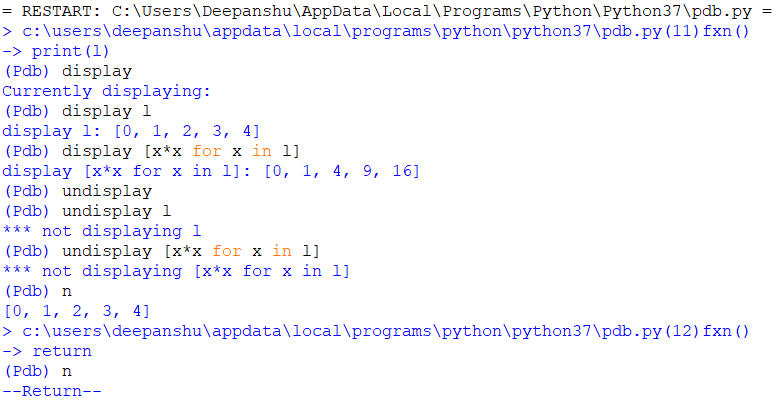
6. Displaying Expressions
Like printing articulations with p and pp, you can utilize the order show [expression] to advise pdb to consequently show the estimation of an articulation, on the off chance that it changed, when execution stops. Utilize the order undisplay [expression] to clear a showcase articulation.
display [expression]
Display the value of the expression if it changed, each time execution stops in the current frame. Without expression, list all display expressions for the current frame.
undisplay [expression]
Do not display the expression any more in the current frame. Without expression, clear all display expressions for the current frame.
Python3
import pdb
def fxn(n):
l = []
for i in range(n):
l.append(i)
pdb.set_trace()
print(l)
return
fxn(5)
|
Output:
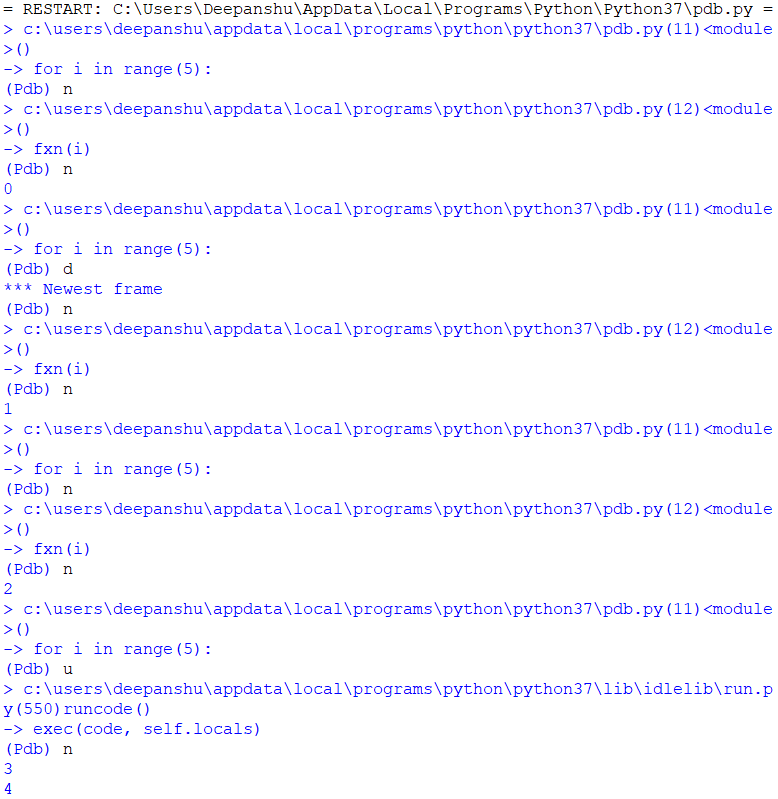
7. Frames up-down
Here, we can play with each trace as a frame, and we can also move from one frame to another.
w(here)
Print a stack trace, with the most recent frame at the bottom. An arrow indicates the “current frame”, which determines the context of most commands. ‘bt’ is an alias for this command.
u(p) [count]
Move the current frame count (default one) levels up in the stack trace (to an older frame).
d(own) [count]
Move the current frame count (default one) levels down in the stack trace (to a newer frame).
Python3
import pdb
def fxn(i):
print(i)
return
pdb.set_trace()
for i in range(5):
fxn(i)
|
Output:
Like Article
Suggest improvement
Share your thoughts in the comments
Please Login to comment...