Microsoft offers a service for business analytics called Power BI. It seeks to offer business intelligence capabilities and interactive visualizations with a user interface that is straightforward enough for users to build their own reports and dashboards. Here, we are using the dataset that contains information on the library supplies sold by a library manufacturer to different clients. All the relevant details like order date, client name, product name, product unit, etc. can be seen in it. Below is the link to download the dataset.
Dataset Used: [SLS Order Details_Master, SLS Order Details_Product Master, Sheet1 ]
DAX Aggregate Functions
It’s possible for the mathematical operation to be a sum, average, maximum, count, or another. The process of combining values in your data is known as aggregating. An aggregate is the outcome of the mathematical procedure. Your data may be aggregated when Power BI service and Power BI Desktop build visuals.
In accordance with the expression, these functions compute a (scalar) value for each row in a column or table, such as count, sum, average, minimum, or maximum. Execution of the query creates a measure in the field. Drag a table from the visualizations and the measured field over it to get the output.
DAX Average
This function computes the average of the values contained in the provided column as input. A row is counted among the number of rows used as the divisor when a cell carries a value of 0, which is added to the sum of all the numbers. The row is not tallied when a cell is blank, though.
Syntax of DAX Average
AVERAGE(<column>)
Example:
Here the function calculates the average number of orders received per day.
Formula: average = AVERAGE('SLS Order Detials_Master'[Image])

average
DAX AverageA
Gives the average (arithmetic mean) of the values in a column. The AVERAGEA function averages the values in a column and also manages non-numeric data types in accordance with the following guidelines:
- Values that are TRUE, count as 1.
- Empty text (“”) counts as 0 (zero). Non-numeric text values have a count of 0 (zero).
- FALSE values are counted as 0 values (zero).
Syntax of DAX AverageA
AVERAGEA(<column>)
average a
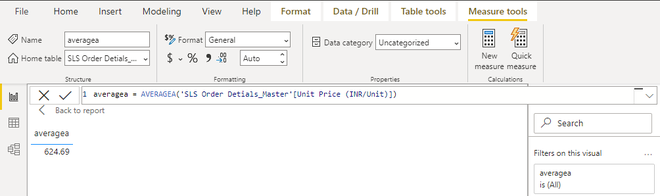
Example:
Here the function calculates the average of the unit price of orders received per day.
Formula: averagea = AVERAGEA('SLS Order Detials_Master'[Unit Price (INR/Unit)])
DAX AverageX
Calculates the average (arithmetic mean) of a set of expressions evaluated over a table.
Syntax of DAX AverageX
AVERAGEX(<table>,<expression>)
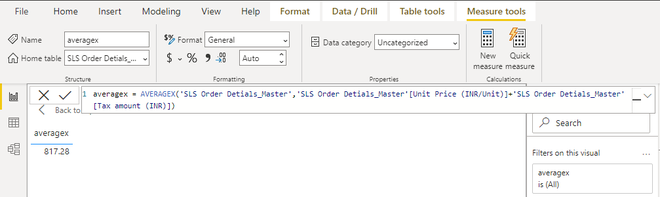
Example:
Evaluating the average of the column’s value returned by adding the unit price of each product to the TAX incurred on it.
Formula: averagex = AVERAGEX('SLS Order Detials_Master',
                    'SLS Order Detials_Master'[Unit Price (INR/Unit)]+
                    'SLS Order Detials_Master'[Tax amount (INR)])
average x
DAX Count
This function only accepts a column as an argument. The following types of values are counted in rows using the COUNT function:
Syntax of DAX Count
COUNT(<column>)
Example:
Counting the number of orders as per date.
Formula: Count = COUNT('SLS Order Detials_Master' [Book Date (dd-mm-yyyy)])

count
DAX CountA
Determines how many rows in the chosen column have non-blank values. The function returns a blank if it cannot locate any rows to count.
Syntax of DAX CountA
COUNTA(<column>)
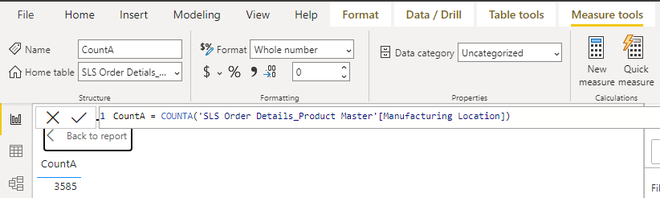
Example:
Counting the number of products that have manufacturing locations specified on them.
Formula: CountA = COUNTA('SLS Order Detials_Master' [Manufacturing Location])
countA
DAX CountX
When evaluating an expression over a table, counts the number of rows that contain a number or an expression that evaluates to a number.
It can be used to calculate the counts of rows based on certain expressions within FILTER. Two arguments are needed for the COUNTX function. A table or any expression returning a table must always be the first argument. The column or expression that COUNTX searches for is the second input
Syntax of DAX CountX
COUNTX(<table, expression>)
COUNTX(FILTER(<table, expression>, [column of which counts needs to be returned]))
Example:
Returning the number of products that have a unit price greater than 1000.
Formula: CountX = COUNTX(FILTER('SLS Order Detials_Master',
            'SLS Order Detials_Master'[Unit Price (INR/Unit)] > 1000),
            [Product Quanitity]))

countX
DAX CountAX
Counts non-blank results when evaluating the result of an expression over a table.
When determining the outcome of an expression over a table, the COUNTAX function counts results that are not blank. In other words, it functions just like the COUNTA function but is used to loop across table rows and count the rows where the supplied expressions return a result that is not blank.
Syntax of DAX CountAX
COUNTAX(<table, expression>)
Example:
Formula: CountAX = COUNTAX('SLS Order Detials_Master', 'SLS Order Detials_Master'[Total amount (INR)])
DAX CountBlank
A column is the only argument this function accepts. Columns can include any kind of data, but only blank cells are counted. Due to the fact that zero is a valid numeric value and not a blank cell, cells with the value zero (0) are not counted.
Syntax of DAX CountBlank
COUNTBLANK(<column>)
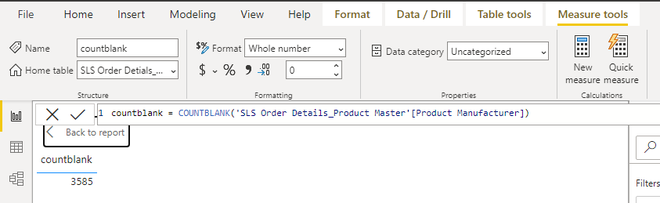
Example:
Formula: countblank = COUNTBLANK('SLS Order Detials_Master'[Product Manufacturer])
count blank
DAX CountRows
Determines how many rows there are in the supplied table or a table that has been defined using an expression.
Syntax of DAX CountRows
COUNTROWS([<table>])
Example:
Formula: COUNTROWS('SLS Order Details_Master')
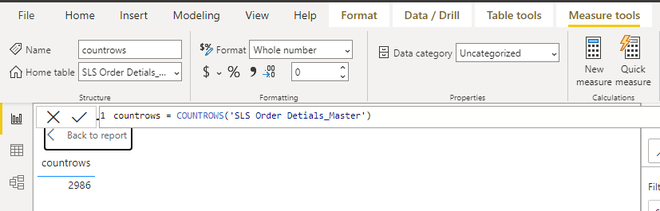
count rows
DAX DistinctCount
Determines how many unique values there are in a column.
This function only accepts a column as an argument. You can utilize columns with any kind of data in them. The function returns a BLANK if there are no rows to count; otherwise, it gives the number of distinct values.
Syntax of DAX DistinctCount
DISTINCTCOUNT(<column>)
Example:
Formula: distinctcount = DISTINCTCOUNT('SLS Order Detials_Product Master'[Image])
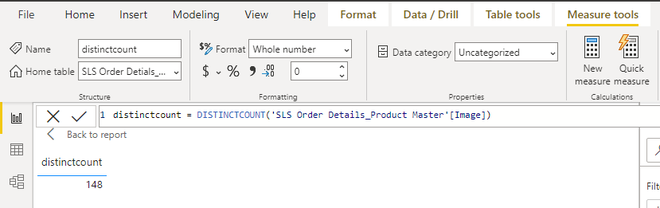
distinct count
DAX DistinctCountNoBlank
Counts the number of distinct values in a column.
Syntax of DAX DistinctCountNoBlank
DISTICTCOUNTNOBLANK(<column>)
Example:
Formula: distinct count no blank = DISTINCTCOUNTNOBLANK('SLS Order Detials_Master'[Product Name] )

distinct count no blank
DAX Max
Returns the largest numeric value in a column, or between two scalar expressions.
Syntax of DAX Max
MAX(<column>) /
MAX(<expression1, expression2>)

max
Example:
Formula: max = MAX('SLS Order Detials_Master'[Unit Price (INR/Unit)])
DAX MaxA
Returns the largest value in a column.
Syntax of DAX MaxA
MAXA(<column>)
Example:
Formula: maxa = MAXA('SLS Order Detials_Master'[Total amount (INR)])

max a
DAX Maxx
Evaluates an expression for each row of a table and return the largest numeric value.
Syntax of DAX Maxx
MAXX(<table, expression>)
Example:
Formula: maxx = MAXX('SLS Order Detials_Master',
                    'SLS Order Detials_Master'[Image] +
                    'SLS Order Detials_Master'[Unit Price (INR/Unit)])

max x
DAX Min
Returns the smallest numeric value in a column, or between two scalar expressions.
Syntax of DAX Min
MIN(<column>)
Example:
Formula: min = MIN('SLS Order Detials_Master'[Unit Price (INR/Unit)])

min
DAX MinA
Returns the smallest value in a column, including any logical values and numbers represented as text.
Syntax of DAX MinA
MINA(<column>)
Example:
Formula: mina = MINA('SLS Order Detials_Master'[Tax amount (INR)])
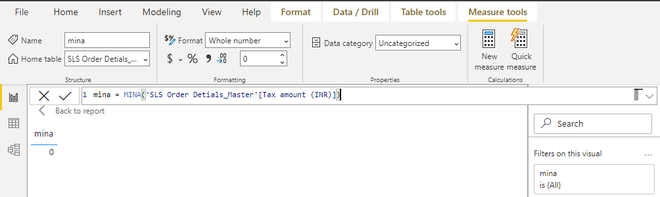
min a
DAX MinX
Returns the smallest numeric value that results from evaluating an expression for each row of a table.
Syntax of DAX MinX
MINX(<table, expression>)
Example:
Formula: minx = MINX('SLS Order Detials_Master',
                'SLS Order Detials_Master'[Image] +
                'SLS Order Detials_Master'[Unit Price (INR/Unit)])
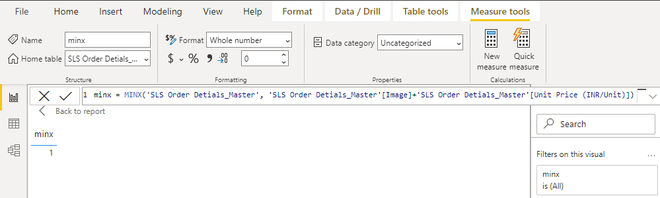
min x
DAX Product
Returns the product of the numbers in a column.
Syntax of DAX Product
PRODUCT(<column>)
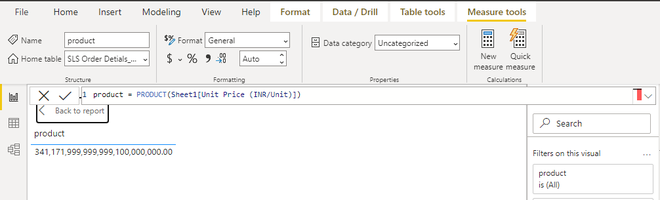
product
Example:
Formula: product = PRODUCT(Sheet1[Unit Price (INR/Unit)])
DAX ProductX
Returns the product of an expression evaluated for each row in a table.
Syntax of DAX ProductX
PRODUCTX(<table, expression>)
Example:
Formula: productx = PRODUCTX(Sheet1,Sheet1[Image]+Sheet1[Unit Price (INR/Unit)])

product x
DAX Sum
Adds all the numbers in a column.
Syntax of DAX Sum
SUM(<column>)
Example:
Formula: sum = SUM(Sheet1[Unit Price (INR/Unit)])

sum
DAX SumX
Returns the sum of an expression evaluated for each row in a table.
Syntax of DAX SumX
SUMX(<table, expression>)
Example:
Formula: sumx = SUMX(Sheet1,Sheet1[Image]+Sheet1[Unit Price (INR/Unit)])

sum x
Like Article
Suggest improvement
Share your thoughts in the comments
Please Login to comment...