Data Structures in Pandas
Last Updated :
18 Oct, 2021
Pandas is an open-source library that uses for working with relational or labeled data both easily and intuitively. It provides various data structures and operations for manipulating numerical data and time series. It offers a tool for cleaning and processes your data. It is the most popular Python library that is used for data analysis. In this article, We are going to learn about Pandas Data structure.
It supports two data structures:
Series
Pandas is a one-dimensional labeled array and capable of holding data of any type (integer, string, float, python objects, etc.)
Syntax: pandas.Series(data=None, index=None, dtype=None, name=None, copy=False, fastpath=False)
Parameters:
- data: array- Contains data stored in Series.
- index: array-like or Index (1d)
- dtype: str, numpy.dtype, or ExtensionDtype, optional
- name: str, optional
- copy: bool, default False
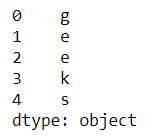
Example 1: Series holding the char data type.
Python3
import pandas as pd
list = ['g', 'e', 'e', 'k', 's']
res = pd.Series(list)
print(res)
|
Output:
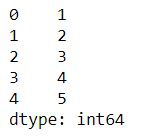
Example 2: Series holding the Int data type.
Python3
import pandas as pd
list = [1,2,3,4,5]
res = pd.Series(list)
print(res)
|
Output:
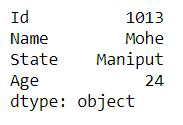
Example 3: Series holding the dictionary.
Python3
import pandas as pd
dic = { 'Id': 1013, 'Name': 'MOhe',
'State': 'Maniput','Age': 24}
res = pd.Series(dic)
print(res)
|
Output:
Dataframe
Pandas DataFrame is a two-dimensional size-mutable, potentially heterogeneous tabular data structure with labeled axes (rows and columns). A Data frame is a two-dimensional data structure, i.e., data is aligned in a tabular fashion in rows and columns like a spreadsheet or SQL table, or a dict of Series objects. . Pandas DataFrame consists of three principal components, the data, rows, and columns.
In the real world, a Pandas DataFrame will be created by loading the datasets from existing storage, storage can be SQL Database, CSV file, and Excel file. Pandas DataFrame can be created from the lists, dictionary, and from a list of dictionary etc. Dataframe can be created in different ways here are some ways by which we create a dataframe:
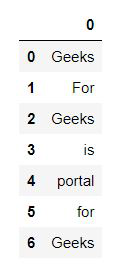
Example 1: DataFrame can be created using a single list or a list of lists.
Python3
import pandas as pd
lst = ['Geeks', 'For', 'Geeks', 'is',
'portal', 'for', 'Geeks']
df = pd.DataFrame(lst)
display(df)
|
Output:
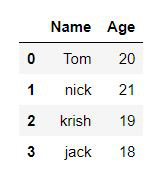
Example 2: Creating DataFrame from dict of ndarray/lists.
To create DataFrame from dict of narray/list, all the narray must be of same length. If index is passed then the length index should be equal to the length of arrays. If no index is passed, then by default, index will be range(n) where n is the array length.
Python3
import pandas as pd
data = {'Name':['Tom', 'nick', 'krish', 'jack'],
'Age':[20, 21, 19, 18]}
df = pd.DataFrame(data)
display(df)
|
Output:
Selection of column: In Order to select a column in Pandas DataFrame, we can either access the columns by calling them by their columns name.
Python3
import pandas as pd
data = {'Name':['Jai', 'Princi', 'Gaurav', 'Anuj'],
'Age':[27, 24, 22, 32],
'Address':['Delhi', 'Kanpur', 'Allahabad', 'Kannauj'],
'Qualification':['Msc', 'MA', 'MCA', 'Phd']}
df = pd.DataFrame(data)
print(df[['Name', 'Qualification']])
|
Output:

How to Select Rows and Column from Pandas DataFrame?
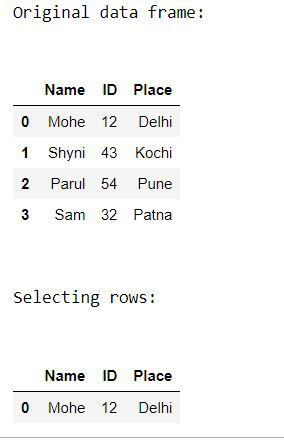
Example 1: Selecting rows.
pandas.DataFrame.loc is a function used to select rows from Pandas DataFrame based on the condition provided.
Syntax: df.loc[df[‘cname’] ‘condition’]
Parameters:
- df: represents data frame
- cname: represents column name
- condition: represents condition on which rows has to be selected
Python3
from pandas import DataFrame
Data = {'Name': ['Mohe', 'Shyni', 'Parul', 'Sam'],
'ID': [12, 43, 54, 32],
'Place': ['Delhi', 'Kochi', 'Pune', 'Patna']
}
df = DataFrame(Data, columns = ['Name', 'ID', 'Place'])
print("Original data frame:\n")
display(df)
select_prod = df.loc[df['Name'] == 'Mohe']
print("\n")
print("Selecting rows:\n")
display (select_prod)
|
Output:
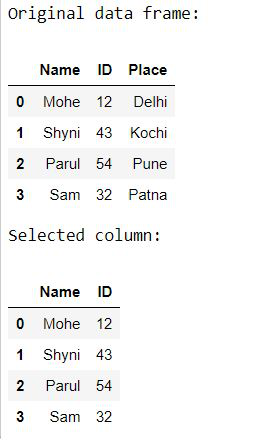
Example 2: Selecting column.
Python3
from pandas import DataFrame
Data = {'Name': ['Mohe', 'Shyni', 'Parul', 'Sam'],
'ID': [12, 43, 54, 32],
'Place': ['Delhi', 'Kochi', 'Pune', 'Patna']
}
df = DataFrame(Data, columns = ['Name', 'ID', 'Place'])
print("Original data frame:")
display(df)
print("Selected column: ")
display(df[['Name', 'ID']] )
|
Output:
Like Article
Suggest improvement
Share your thoughts in the comments
Please Login to comment...