- Courses
- Tutorials
- Jobs
- Practice
- Contests
Data Interpretation
Question 1
Study the following table chart and answer the questions based on it.
Expenditures of a Company (in Lakh Rupees) per Annum Over the given Years.
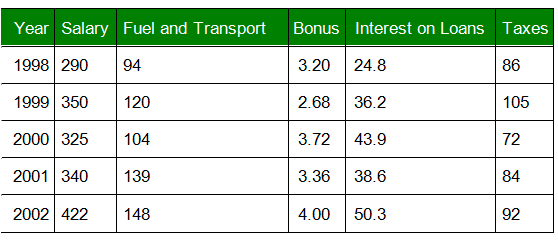
Based on the table answer following 1-5 questions:
What is the average amount of interest per year which the company had to pay during this period ?
Based on the table answer following 1-5 questions:
What is the average amount of interest per year which the company had to pay during this period ?
Question 2
Refer Table from Question number 1 and answer the following:
The total amount of bonus paid by the company during the given period is approximately what percent of the total amount of salary paid during this period ?
The total amount of bonus paid by the company during the given period is approximately what percent of the total amount of salary paid during this period ?
Question 3
Refer Table from Question number 1 and answer the following:
Total expenditure on all these items in 1998 was approximately what percent of the total expenditure in 2002 ?
Total expenditure on all these items in 1998 was approximately what percent of the total expenditure in 2002 ?
Question 4
Refer Table from Question number 1 and answer the following:
Calculate the total expenditure of the company over these items during the year 2000 from the table chart given.
Calculate the total expenditure of the company over these items during the year 2000 from the table chart given.
Question 5
Refer Table from Question number 1 and answer the following:
The ratio between the total expenditure on Taxes for all the years and the total expenditure on Fuel and Transport for all the years respectively is approximately?
The ratio between the total expenditure on Taxes for all the years and the total expenditure on Fuel and Transport for all the years respectively is approximately?
Question 6
Study the following table carefully and answer the questions given below it:
Number of Different categories of vehicles sold in the country over the years (in thousands)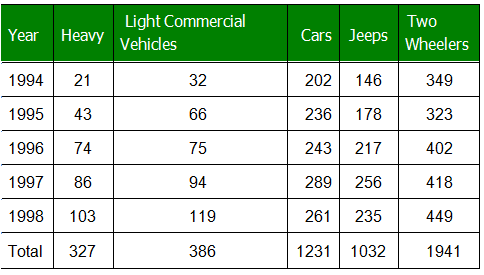
Answer question 6-10 based on data from above table In which of the following years was the number of light commercial vehicles sold approximately 25% of the number of 2-wheelers sold?
Number of Different categories of vehicles sold in the country over the years (in thousands)
Answer question 6-10 based on data from above table In which of the following years was the number of light commercial vehicles sold approximately 25% of the number of 2-wheelers sold?
Question 7
Refer Table from Question number 6 and answer the following:
If the same percentage increase in the number of Heavy Vehicle as in 1998 over 1997 is expected in 1999, approximately how many heavy vehicles will be sold in 1999?
If the same percentage increase in the number of Heavy Vehicle as in 1998 over 1997 is expected in 1999, approximately how many heavy vehicles will be sold in 1999?
Question 8
Refer Table from Question number 6 and answer the following:
The number of heavy vehicles sold in 1997 was approximate what percentage of the total number sold in 1996.
The number of heavy vehicles sold in 1997 was approximate what percentage of the total number sold in 1996.
Question 9
Refer Table from Question number 6 and answer the following:
In which year was the number of two-wheelers sold as a percentage of the total number of vehicle sold during that year the highest.
In which year was the number of two-wheelers sold as a percentage of the total number of vehicle sold during that year the highest.
Question 10
Refer Table from Question number 6 and answer the following:
The percentage increase in the sale in 1996 over the previous year was maximum for which of the following category of vehicle.
The percentage increase in the sale in 1996 over the previous year was maximum for which of the following category of vehicle.
There are 10 questions to complete.
Last Updated :
Take a part in the ongoing discussion