Data Exploration using Pandas GUI
Last Updated :
04 Jan, 2021
Data Preprocessing is an important part of the Data Science pipeline, you need to find out about various irregularities in the data, you manipulate your features, etc. Pandas is a tool that we use very often for manipulating the data, along with seaborn and matplotlib for Data Visualization. PandasGUI is a library that makes this task much easier by providing a GUI interface that can be used to make
Installing PandasGUI
You can install PandasGUI like any other python library using the pip command. The command for the same is:-
pip install pandasgui
Opening a CSV in PandasGUI
To open a CSV file in PandasGUI we need to use the show() function. Let’s start by import it along with pandas. Click here to get the dataset.
Python3
from pandasgui import show
import pandas as pd
|
The next thing we do is to load our CSV as DataFrame using read_csv() and pass that dataframe into the show() as an argument.
Python3
df = pd.read_csv('data.csv')
show(df)
|
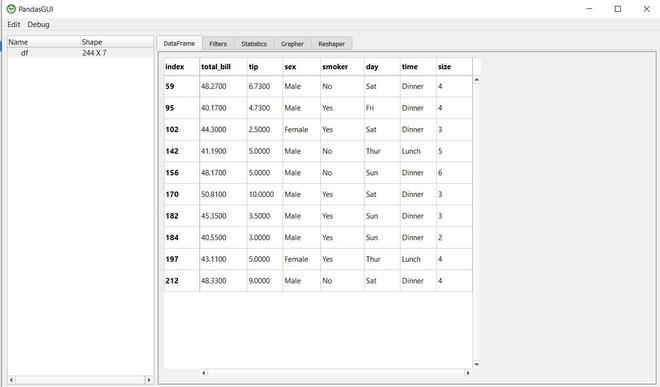
Output:
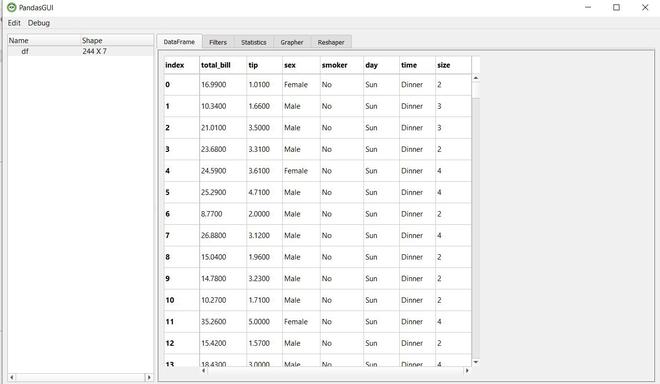
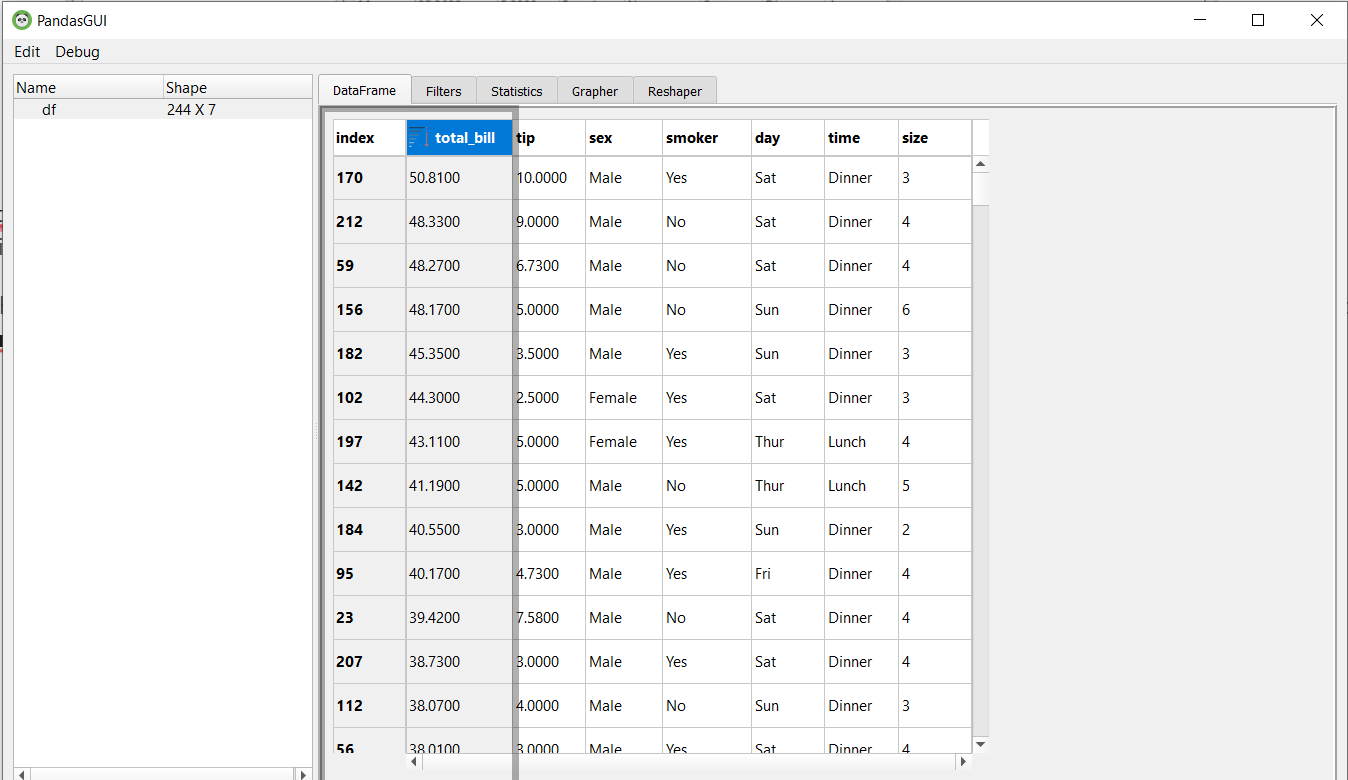
This is our dataframe and we can scroll around and get an overview of the data. You can see empty cells that represent NaN values. You can edit the data by clicking on a cell and editing its value. You can sort the dataframe based on a particular column by simply clicking the column. In the picture below we can sort the dataframe based on the column Total_bill by clicking on it.
Filters in PandasGUI
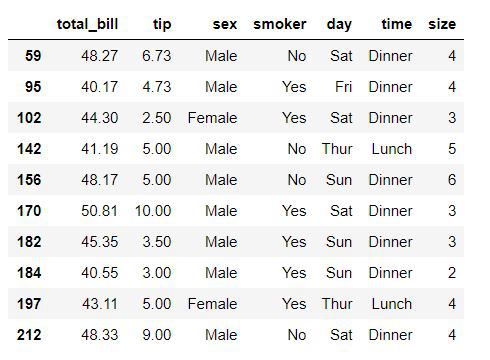
Let’s Suppose we want to see the rows where the value of MSSubClass is greater than or equal to 120. In pandas, we can do that using the following command:-
Python3
df[df['total_bill'] >= 40]
|
Output:
PandasGUI provides us with filters where you can write query expressions to filter the data. The query expression for the above will be:
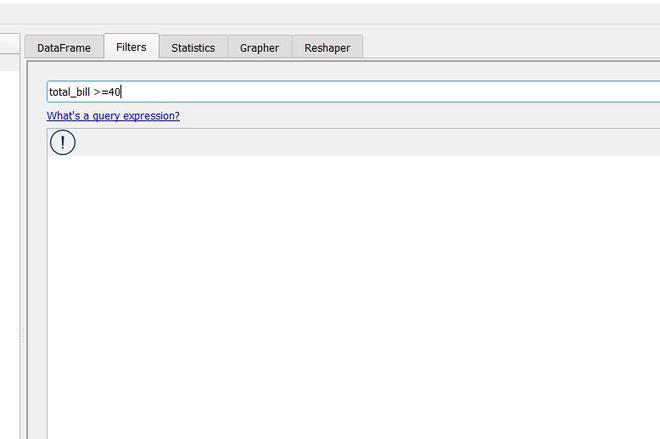
You can write this query expression in Filters and click on Add Filter to apply it. Let’s take a look at the data in the picture below. As you can see the filters were applied successfully.
Statistics in Pandas GUI
Summary Statistics give you an overview of the Data Distribution. In pandas, we use the describe() method to get the statistics of the data.
Output:
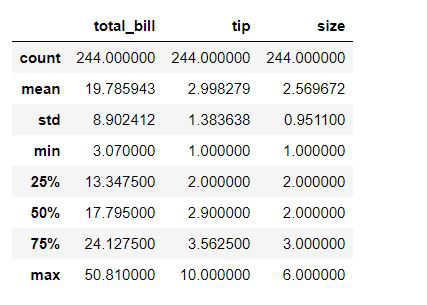
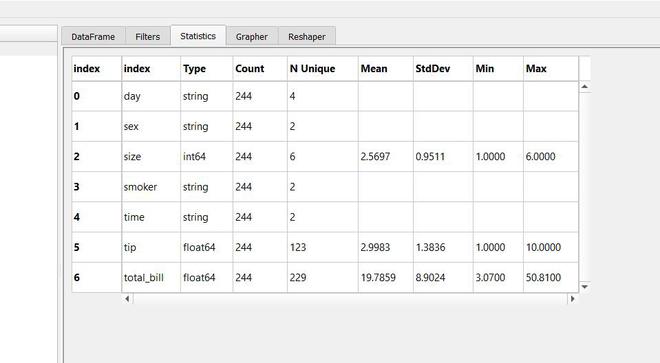
In PandasGUI, you can go to the Statistics section and get the statistics for each column.
Data Visualization in PandasGUI
Data Visualization isn’t something pandas is usually used for, we use libraries like matplotlib, seaborn, plotly, etc. But PandasGUI offers Interactive Graphs plotted using plotly under the Grapher Section.
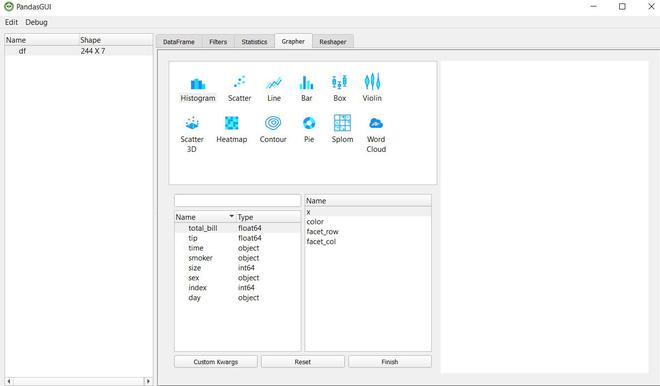
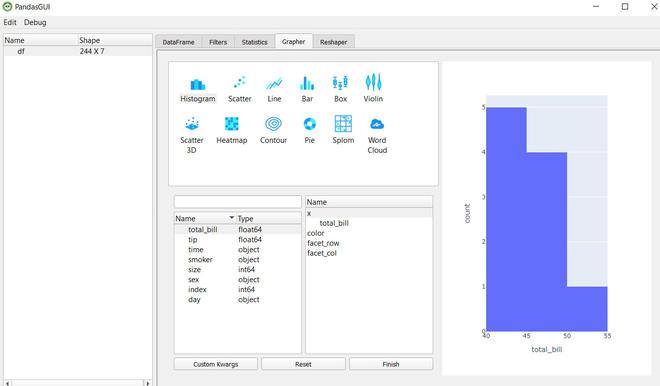
You can plot various types of graphs, let’s create a histogram of total_bill by dragging it and dropping it under x.
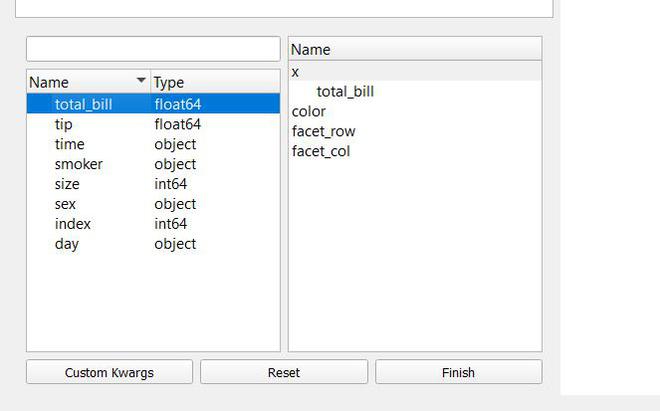
After that just click on Finish and you’ll be able to see your graph.
Let’s make a barplot.
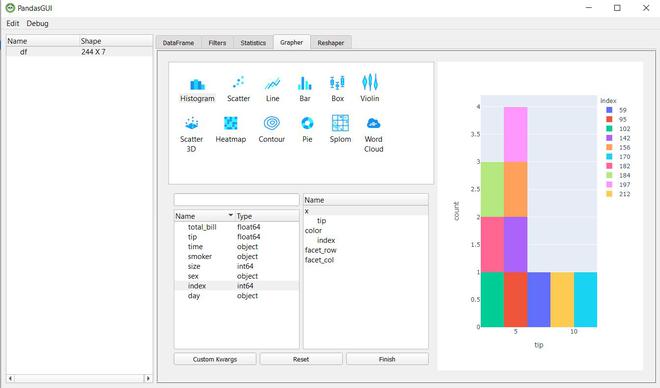
Along with these, you can create a boxplot, 3d scatter plot, line plot, etc. PandasGUI is a great tool if you want a quick overview of your data, from checking summary statistics to plotting data you can do it easily without the need to code.
Like Article
Suggest improvement
Share your thoughts in the comments
Please Login to comment...