Data Cleaning in R
Last Updated :
05 Jul, 2023
In this article, we will briefly be going through Data cleaning with its application and its technique for implementation in the R programming language.
Data Cleaning in R
Data Cleaning in R is the process to transform raw data into consistent data that can be easily analyzed. It is aimed at filtering the content of statistical statements based on the data as well as their reliability. Moreover, it influences the statistical statements based on the data and improves your data quality and overall productivity.
Purpose of Data Cleaning
The following are the various purposes of data cleaning in R:
- Eliminate Errors
- Eliminate Redundancy
- Increase Data Reliability
- Delivery Accuracy
- Ensure Consistency
- Assure Completeness
- Standardize your approach
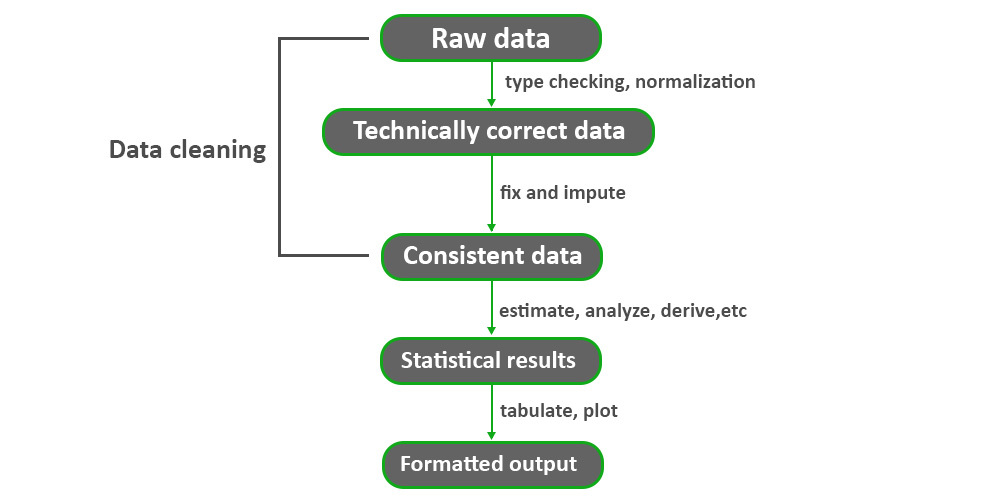
Overview of a typical data analysis chain
This section represents an overview of typical data analysis. Each rectangle in the figure represents data in a certain state while each arrow represents the activities needed to get from one state to the other. The first state (Raw data) is the data as it comes in. Raw data may lack headers, contain wrong data types, wrong category labels, unknown or unexpected character encoding, and so on. Once this preprocessing has taken place, data can be deemed Technically correct Data. That is, in this state data can be read into an R data. frame, with correct names, types, and labels, without further trouble. However, this does not mean that the values are error-free or complete. Consistent data is the stage where data is ready for statistical inference. It is the data that most statistical theories use as a starting point.
Data Cleaning in R
How to clean data in R
Here, this involves various steps, as from the initial raw data have to move toward the consistent and highly efficient data which is ready to be implemented as per the requirements and produces highly precise and accurate statistical results. The steps vary from data to data in this case the user should be aware of the date he/she is using for the results. As there are many characteristics and common symptoms of messy data which totally depend on the data used by the user for analysis.
Characteristics of clean data include data are:
- Free of duplicate rows/values
- Error-free (misspellings free )
- Relevant (special characters free )
- The appropriate data type for analysis
- Free of outliers (or only contain outliers that have been identified/understood)
- Follows a “tidy data” structure
Common symptoms of messy data:
- Special characters (e.g. commas in numeric values)
- Numeric values stored as text/character data types
- Duplicate rows
- Misspellings
- Inaccuracies
- White space
- Missing data
- Zeros instead of null values vary.
Let’s Start the implementation of Data Cleaning in R
For this, we will use inbuilt datasets(air quality datasets) which are available in R.
Output:
  Ozone Solar.R Wind Temp Month Day
1    41     190  7.4   67     5   1
2    36     118  8.0   72     5   2
3    12     149 12.6   74     5   3
4    18     313 11.5   62     5   4
5    NA      NA 14.3   56     5   5
6    28      NA 14.9   66     5   6
In the above dataset, we can clearly see the NA value inside the columns which will generate the error or not produce the accurate predictions for Machine Learning Model.
Handling missing values in R
To handle the missing value we will check the columns of the datasets, if we found some missing data inside the columns then this generates the NA values as an output, which can be not good for every model. So let’s check it using mean() methods.
Output:
<NA>
Checking another column
Output:
<NA>
Checking another column
Here we get the mean value of Wind Columns which means it doesn’t have any missing value in this column.
Output:
9.95751633986928
Handling NA values
Handling NA value using na.rm in both columns.
R
mean(airquality$Solar.R, na.rm = TRUE)
|
Output:
185.931506849315
Also performing the same operation on another column.
R
mean(airquality$Ozone, na.rm = TRUE)
|
Output:
42.1293103448276
Data Cleaning Operation
After checking the summary of the dataset and we found the number on NA in two columns(Ozone and Solar.R)
Output:
     Ozone           Solar.R           Wind             Temp           Month
 Min.   :  1.00   Min.   :  7.0   Min.   : 1.700   Min.   :56.00   Min.   :5.000
 1st Qu.: 18.00   1st Qu.:115.8   1st Qu.: 7.400   1st Qu.:72.00   1st Qu.:6.000
 Median : 31.50   Median :205.0   Median : 9.700   Median :79.00   Median :7.000
 Mean   : 42.13   Mean   :185.9   Mean   : 9.958   Mean   :77.88   Mean   :6.993
 3rd Qu.: 63.25   3rd Qu.:258.8   3rd Qu.:11.500   3rd Qu.:85.00   3rd Qu.:8.000
 Max.   :168.00   Max.   :334.0   Max.   :20.700   Max.   :97.00   Max.   :9.000
 NA's   :37       NA's   :7
      Day
 Min.   : 1.0
 1st Qu.: 8.0
 Median :16.0
 Mean   :15.8
 3rd Qu.:23.0
 Max.   :31.0
We can get a clear visual of the irregular data using a boxplot.
Output:

Boxplot of Airquality Dataset
Removing irregularities data with is.na() methods.
R
New_df = airquality
New_df$Ozone = ifelse(is.na(New_df$Ozone),
median(New_df$Ozone,
na.rm = TRUE),
New_df$Ozone)
summary(New_df)
|
Output:
     Ozone           Solar.R           Wind             Temp           Month
 Min.   :  1.00   Min.   :  7.0   Min.   : 1.700   Min.   :56.00   Min.   :5.000
 1st Qu.: 21.00   1st Qu.:115.8   1st Qu.: 7.400   1st Qu.:72.00   1st Qu.:6.000
 Median : 31.50   Median :205.0   Median : 9.700   Median :79.00   Median :7.000
 Mean   : 39.56   Mean   :185.9   Mean   : 9.958   Mean   :77.88   Mean   :6.993
 3rd Qu.: 46.00   3rd Qu.:258.8   3rd Qu.:11.500   3rd Qu.:85.00   3rd Qu.:8.000
 Max.   :168.00   Max.   :334.0   Max.   :20.700   Max.   :97.00   Max.   :9.000
                  NA's   :7
      Day
 Min.   : 1.0
 1st Qu.: 8.0
 Median :16.0
 Mean   :15.8
 3rd Qu.:23.0
 Max.   :31.0
Performing the same operation in another column.
R
New_df$Solar.R = ifelse(is.na(New_df$Solar.R),
median(New_df$Solar.R,
na.rm = TRUE),
New_df$Solar.R)
|
Now can clearly see that we don’t have any unclean data using summary methods.
Output:
     Ozone           Solar.R           Wind             Temp           Month
 Min.   :  1.00   Min.   :  7.0   Min.   : 1.700   Min.   :56.00   Min.   :5.000
 1st Qu.: 21.00   1st Qu.:120.0   1st Qu.: 7.400   1st Qu.:72.00   1st Qu.:6.000
 Median : 31.50   Median :205.0   Median : 9.700   Median :79.00   Median :7.000
 Mean   : 39.56   Mean   :186.8   Mean   : 9.958   Mean   :77.88   Mean   :6.993
 3rd Qu.: 46.00   3rd Qu.:256.0   3rd Qu.:11.500   3rd Qu.:85.00   3rd Qu.:8.000
 Max.   :168.00   Max.   :334.0   Max.   :20.700   Max.   :97.00   Max.   :9.000
      Day
 Min.   : 1.0
 1st Qu.: 8.0
 Median :16.0
 Mean   :15.8
 3rd Qu.:23.0
 Max.   :31.0
We can clearly see that we don’t have any missing data inside data frame.
Output:
  Ozone Solar.R Wind Temp Month Day
1  41.0     190  7.4   67     5   1
2  36.0     118  8.0   72     5   2
3  12.0     149 12.6   74     5   3
4  18.0     313 11.5   62     5   4
5  31.5     205 14.3   56     5   5
6  28.0     205 14.9   66     5   6
Now our boxplot outliers also show no errors.

Boxplot of Airquality Data set
Depending on the nature of the dataset and the cleaning requirements, many techniques and functions may be employed to clean the data. Before moving on to further in-depth research, exploratory data analysis and rigorous study of the data are essential in spotting and resolving data quality issues.
Share your thoughts in the comments
Please Login to comment...