D3.js line.y() Method
Last Updated :
31 Aug, 2020
The line.y() method sets or returns the y accessor point of the line. If y is provided, it must be a number or a function that returns a number.
Syntax:
d3.line.y();
Parameters:
- y-point: This method takes a y-point that can be set from the points array.
Return Value: This method returns the y accessor point of the line.
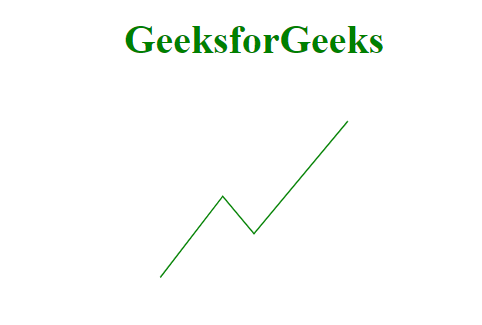
Example 1: Setting the y-point using this method. For x-points here we have used line.x() function.
HTML
<!DOCTYPE html>
<html>
<meta charset="utf-8">
<head>
<script src=
</script>
</head>
<body>
<h1 style="text-align:center; color:green;">
GeeksforGeeks
</h1>
<center>
<svg id="gfg" width="200"
height="200">
</svg>
</center>
<script>
var points = [
{ xpoint: 25, ypoint: 150 },
{ xpoint: 75, ypoint: 85 },
{ xpoint: 100, ypoint: 115 },
{ xpoint: 175, ypoint: 25 }];
var Gen = d3.line()
.x((p) => p.xpoint)
// Setting the y-point
.y((p) => p.ypoint);
d3.select("#gfg")
.append("path")
.attr("d", Gen(points))
.attr("fill", "none")
.attr("stroke", "green");
</script>
</body>
</html>
|
Output:
Example 2: Getting the function for y points.
HTML
<!DOCTYPE html>
<html>
<meta charset="utf-8">
<head>
<script src=
</script>
</head>
<body>
<h1 style="text-align:center; color:green;">
GeeksforGeeks
</h1>
<center>
<svg id="gfg" width="200" height="200"></svg>
</center>
<script>
var points = [
{ xpoint: 25, ypoint: 150 },
{ xpoint: 75, ypoint: 85 },
{ xpoint: 100, ypoint: 115 },
{ xpoint: 175, ypoint: 25 }];
var Gen = d3.line()
.x((p) => p.xpoint)
.y((p) => p.ypoint);
d3.select("#gfg")
.append("path")
.attr("d", Gen(points))
.attr("fill", "none")
.attr("stroke", "green");
console.log(Gen.y());
console.log(Gen.y)
</script>
</body>
</html>
|
Output:

Like Article
Suggest improvement
Share your thoughts in the comments
Please Login to comment...