D3.js curveStep() Method
Last Updated :
18 Sep, 2020
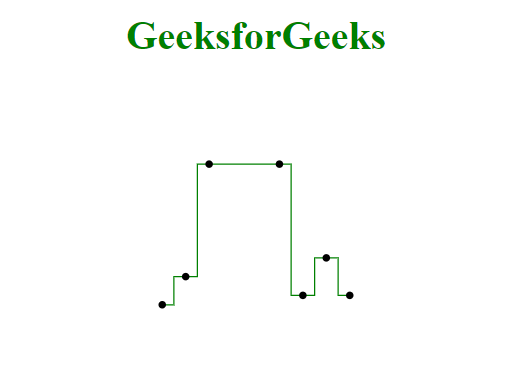
The step curve interpolator creates vertical and horizontal lines representing a step function. A vertical line is created for each pair of points in the dataset. For each pair of points, the vertical line is positioned at the midpoint between the x coordinate.
Syntax:
d3.curveStep()
Parameters: This method does not accept any parameters
Return Value: This method does not return any value.
Example 1:
HTML
<!DOCTYPE html>
<html>
<meta charset="utf-8">
<head>
<script src=
</script>
</head>
<body>
<h1 style="text-align:center; color:green;">
GeeksforGeeks
</h1>
<center>
<svg id="gfg" width="200" height="200"></svg>
</center>
<script>
var data = [
{ x: 0, y: 0 },
{ x: 1, y: 3 },
{ x: 2, y: 15 },
{ x: 5, y: 15 },
{ x: 6, y: 1 },
{ x: 7, y: 5 },
{ x: 8, y: 1 }];
var xScale = d3.scaleLinear()
.domain([0, 8]).range([25, 175]);
var yScale = d3.scaleLinear()
.domain([0, 20]).range([175, 25]);
var line = d3.line()
.x((d) => xScale(d.x))
.y((d) => yScale(d.y))
// curveStep is used
.curve(d3.curveStep);
d3.select("#gfg")
.append("path")
.attr("d", line(data))
.attr("fill", "none")
.attr("stroke", "green");
// Defining points
d3.select('#gfg')
.selectAll('circle')
.data(data)
.enter()
.append('circle')
.attr('cx', (d) => xScale(d.x))
.attr('cy', (d) => yScale(d.y))
.attr('r', 3);
</script>
</body>
</html>
|
Output:
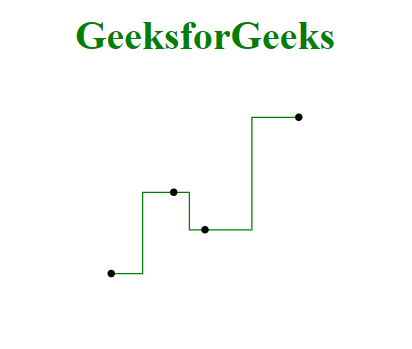
Example 2:
HTML
<!DOCTYPE html>
<html>
<meta charset="utf-8">
<head>
<script src=
</script>
</head>
<body>
<h1 style="text-align:center; color:green;">
GeeksforGeeks
</h1>
<center>
<svg id="gfg" width="200" height="200"></svg>
</center>
<script>
var points = [
{ xpoint: 25, ypoint: 150 },
{ xpoint: 75, ypoint: 85 },
{ xpoint: 100, ypoint: 115 },
{ xpoint: 175, ypoint: 25 }];
var Gen = d3.line()
.x((p) => p.xpoint)
.y((p) => p.ypoint)
.curve(d3.curveStep);
d3.select("#gfg")
.append("path")
.attr("d", Gen(points))
.attr("fill", "none")
.attr("stroke", "green");
// Defining points
d3.select('#gfg')
.selectAll('circle')
.data(points)
.enter()
.append('circle')
.attr('cx', (d) => (d.xpoint))
.attr('cy', (d) => (d.ypoint))
.attr('r', 3);
</script>
</body>
</html>
|
Output:
Like Article
Suggest improvement
Share your thoughts in the comments
Please Login to comment...