D3.js curveLinear() Method
Last Updated :
26 Aug, 2020
The curve linear interpolater creates multiple lines by choosing points that create straight lines between each pair of adjacent points in the dataset. The d3.curveLinear interpolator is the default interpolator used when the line.curve() method is not called.
Syntax:
d3.curveLinear()
Parameters: This method does not accept any parameters
Return Value: This method does not return any value.
Example 1:
HTML
<!DOCTYPE html>
<html>
<head>
<meta charset="utf-8">
<script src=
</script>
</head>
<body>
<h1 style="text-align:center; color: green;">
GeeksforGeeks</h1>
<center>
<svg id="gfg" width="200" height="200">
</svg>
</center>
<script>
var data = [
{ x: 0, y: 0 },
{ x: 1, y: 3 },
{ x: 2, y: 15 },
{ x: 5, y: 15 },
{ x: 6, y: 1 },
{ x: 7, y: 5 },
{ x: 8, y: 1 }];
var xScale = d3.scaleLinear()
.domain([0, 8]).range([25, 175]);
var yScale = d3.scaleLinear()
.domain([0, 20]).range([175, 25]);
var line = d3.line()
.x((d) => xScale(d.x))
.y((d) => yScale(d.y))
// curveLinear is used
.curve(d3.curveLinear);
d3.select("#gfg")
.append("path")
.attr("d", line(data))
.attr("fill", "none")
.attr("stroke", "green");
</script>
</body>
</html>
|
Output:

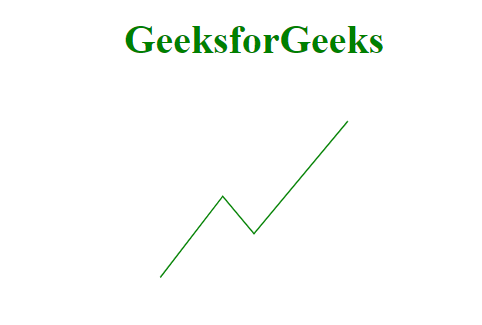
Example 2:
HTML
<!DOCTYPE html>
<html>
<head>
<meta charset="utf-8">
<script src="
</script>
</head>
<body>
<h1 style="text-align:center;color:green;">
GeeksforGeeks</h1>
<center>
<svg id="gfg" width="200" height="200">
</svg>
</center>
<script>
var points = [
{ xpoint: 25, ypoint: 150 },
{ xpoint: 75, ypoint: 85 },
{ xpoint: 100, ypoint: 115 },
{ xpoint: 175, ypoint: 25 }];
var Gen = d3.line()
.x((p) => p.xpoint)
.y((p) => p.ypoint)
.curve(d3.curveLinear);
d3.select("#gfg")
.append("path")
.attr("d", Gen(points))
.attr("fill", "none")
.attr("stroke", "green");
</script>
</body>
</html>
|
Output:
Like Article
Suggest improvement
Share your thoughts in the comments
Please Login to comment...