D3.js axisLeft() Function
Last Updated :
29 Jul, 2020
Axes can be drawn using built-in D3 functions. It is made of Lines, Ticks and Labels. Axis API can be configured using the following script.
<script src = "https://d3js.org/d3-axis.v1.min.js"></script>
The d3.axisLeft() function in D3.js is used to create a left vertical axis. This function will construct a new left-oriented axis generator for the given scale, with empty tick arguments, a tick size of 6 and padding of 3.
Syntax:
d3.axisLeft( scale )
Parameters: This function accepts only one parameter as mentioned above and described below:
- scale: This parameter holds the used scale.
Return Value: This function returns a created left vertical axis.
Below programs illustrate the d3.axisLeft() function in D3.js:
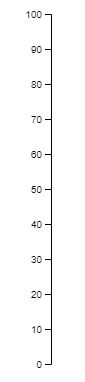
Example 1:
HTML
<html>
<head>
<title>
D3.js d3.axisLeft() Function
</title>
<script type="text/javascript"
</script>
</head>
<body>
<script>
var width = 400, height = 400;
var svg = d3.select("body")
.append("svg")
.attr("width", width)
.attr("height", height);
var yscale = d3.scaleLinear()
.domain([0, 100])
.range([height - 50, 0]);
var y_axis = d3.axisLeft(yscale);
svg.append("g")
.attr("transform", "translate(100, 10)")
.call(y_axis)
</script>
</body>
</html>
|
Output:
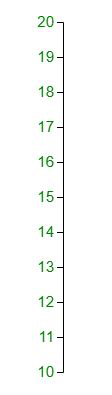
Example 2:
HTML
<!DOCTYPE html>
<html>
<head>
<title>
D3.js d3.axisLeft() Function
</title>
<script type="text/javascript"
</script>
<style>
svg text {
fill: green;
font: 15px sans-serif;
text-anchor: center;
}
</style>
</head>
<body>
<script>
var width = 400, height = 400;
var data = [10, 12, 14, 16, 18, 20];
var svg = d3.select("body")
.append("svg")
.attr("width", width)
.attr("height", height);
var yscale = d3.scaleLinear()
.domain([d3.min(data), d3.max(data)])
.range([height - 50, 0]);
var y_axis = d3.axisLeft(yscale);
svg.append("g")
.attr("transform", "translate(100, 20)")
.call(y_axis)
</script>
</body>
</html>
|
Output:
Like Article
Suggest improvement
Share your thoughts in the comments
Please Login to comment...