D3.js axis.orient() Function
Last Updated :
13 Aug, 2020
The d3.axis.orient() Function in D3.js is used to set the orientation and returns the axis. If the orientation is not specified, returns the current orientation which defaults to “bottom”.
Syntax:
axis.orient([orientation])
Parameters: This function accepts a single parameter as mentioned above and described below:
- orientation: This parameter is size to set the orientation of the axis. Four orientation is supported are: “top”, “bottom”. “left” and “right”.
Return Value: This function returns the axis.
Below programs illustrate the d3.axis.orient() function in D3.js:
Example 1:
HTML
<html>
<head>
<title>
D3.js | d3.axis.orient() Function
</title>
<script src = "//d3js.org/d3.v3.min.js"></script>
</head>
<body>
<script>
var svg = d3.select("body").append("svg")
.attr("width", 400)
.attr("height", 400);
// Create the Scale we will use for the Axis
var axisScale = d3.scale.linear()
.domain([0, 100])
.range([0, 300]);
// Create the Axis
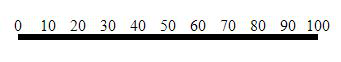
var xAxis = d3.svg.axis()
.scale(axisScale)
.orient("top");
// Create an SVG group Element for the Axis
// elements and call the xAxis function
svg.append("g")
.attr("transform", "translate(50,50)")
.call(xAxis);
</script>
</body>
</html>
|
Output:
Example 2:
HTML
<html>
<head>
<title>
D3.js | d3.axis.orient() Function
</title>
<script src = "//d3js.org/d3.v3.min.js"></script>
</head>
<body>
<script>
var svg = d3.select("body").append("svg")
.attr("width", 400)
.attr("height", 400);
// Create the Scale we will use for the Axis
var axisScale = d3.scale.linear()
.domain([0, 100])
.range([0, 300]);
// Create the Axis
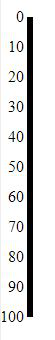
var xAxis = d3.svg.axis()
.scale(axisScale)
.orient("left");
// Create an SVG group Element for the Axis
// elements and call the xAxis function
svg.append("g")
.attr("transform", "translate(50,50)")
.call(xAxis);
</script>
</body>
</html>
|
Output:
Example 3:
HTML
<html>
<head>
<title>
D3.js | d3.axis.orient() Function
</title>
<script src = "//d3js.org/d3.v3.min.js"></script>
</head>
<body>
<script>
var svg = d3.select("body").append("svg")
.attr("width", 400)
.attr("height", 400);
// Create the Scale we will use for the Axis
var axisScale = d3.scale.linear()
.domain([0, 100])
.range([0, 300]);
// Create the Axis
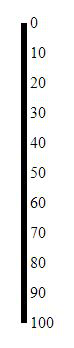
var xAxis = d3.svg.axis()
.scale(axisScale)
.orient("right");
// Create an SVG group Element for the Axis
// elements and call the xAxis function
svg.append("g")
.attr("transform", "translate(50,50)")
.call(xAxis);
</script>
</body>
</html>
|
Output:
Like Article
Suggest improvement
Share your thoughts in the comments
Please Login to comment...