D3.js areaRadial.defined() Method
Last Updated :
02 Sep, 2020
The areaRadial.defined() method in D3.js lets one specify whether data is defined for a given data point or not. The value is checked for each point using the boolean value or function specified as a parameter to this method. The checked value is kept if this method returns true, otherwise it is omitted.
Syntax:
areaRadial.defined( data_point )
Parameters: This function accepts a single parameter as mentioned above and described below:
- data_point: It is a boolean value or function that is used to check every point.
Return Value: This method returns a boolean value.
Below given are a few examples of areaRadial.defined() method in D3.js:
Example 1:
HTML
<!DOCTYPE html>
<html>
<head>
<script src=
</script>
</head>
<body>
<h1 style="text-align: center;
color: green;">
GeeksforGeeks
</h1>
<h3 style="text-align: center;">
D3.js | areaRadial.defined() Method
</h3>
<center>
<svg id="gfg" width="500" height="500">
<g transform="translate(180,180)"></g>
</svg>
</center>
<script>
var data = [
{ x: 10, y: 1 },
{ x: 15, y: 3 },
{ x: 20, y: 5 },
{ x: 25, y: 7 },
{ x: 30, y: 9 },
{ x: 35, y: 11 },
{ x: 40, y: 13 }];
var xScale = d3.scaleLinear()
.domain([0, 8])
.range([25, 200]);
var yScale = d3.scaleLinear()
.domain([0, 20])
.range([200, 25]);
var Gen = d3.areaRadial()
.angle(d => xScale(d.x / 3))
.innerRadius(d => yScale(d.y / 2))
.outerRadius(d => yScale(d.y))
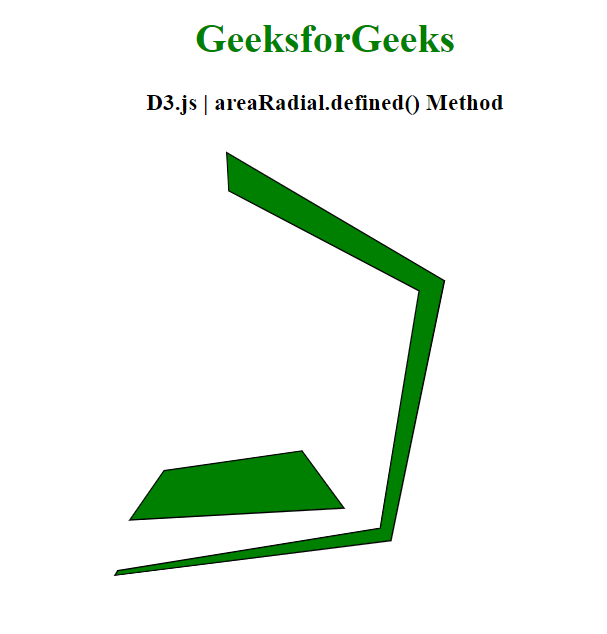
// Omitting 4th index
.defined((d, i) => (i != 4));
d3.select("#gfg")
.select("g")
.append("path")
.attr("d", Gen(data))
.attr("fill", "green")
.attr("stroke", "black");
</script>
</body>
</html>
|
Output:
Example 2:
HTML
<!DOCTYPE html>
<html>
<head>
<script src=
</script>
</head>
<body>
<h1 style="text-align: center;
color: green;">
GeeksforGeeks
</h1>
<h3 style="text-align: center;">
D3.js | areaRadial.defined() Method
</h3>
<center>
<svg id="gfg" width="200" height="200">
<g transform="translate(100,100)"></g>
</svg>
</center>
<script>
var points = [
{ x: 0, y: 0 },
{ x: 2, y: 3 },
{ x: 4, y: 1 },
{ x: 6, y: 8 },
{ x: 8, y: 17 },
{ x: 10, y: 15 },
{ x: 12, y: 20 }];
var xScale = d3.scaleLinear()
.domain([0, 6])
.range([0, 2 * Math.PI]);
var yScale = d3.scaleLinear()
.domain([0, 20])
.range([90, 30]);
var Gen = d3.areaRadial()
.angle(d => xScale(d.x / 2))
.innerRadius(d => yScale(d.y) / 2)
.outerRadius(d => yScale(d.y))
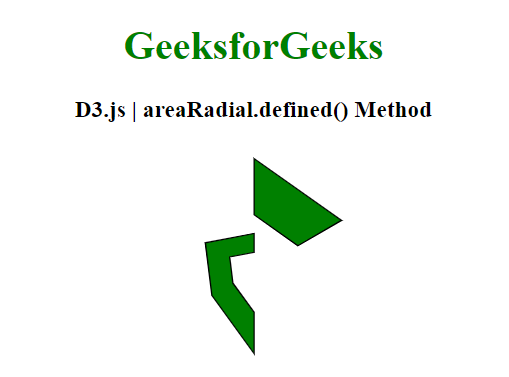
// Omitting 2nd index
.defined((d, i) => (i != 2));
d3.select("#gfg")
.select("g")
.append("path")
.attr("d", Gen(points))
.attr("fill", "green")
.attr("stroke", "black");
</script>
</body>
</html>
|
Output:
Like Article
Suggest improvement
Share your thoughts in the comments
Please Login to comment...