D3.js area.defined() Method
Last Updated :
02 Sep, 2020
The d3.area.defined() method lets you specify whether there is data defined for a given data point or not. If this method returns false, this means that data point exists, else true.
Syntax:
d3.area.defined(data_point)
Parameters: This function accepts a single parameter as mentioned above and described below.
- data_point: This parameter is the data_point to be checked.
Return Value: This method returns a boolean value.
Example 1:
HTML
<!DOCTYPE html>
<html>
<head>
<meta charset="utf-8">
<script src=
</script>
</head>
<body>
<h1 style="text-align: center; color: green;">
GeeksforGeeks
</h1>
<h3 style="text-align: center;">
D3.js | d3.area.defined() Method
</h3>
<center>
<svg id="gfg" width="200" height="200">
</svg>
</center>
<script>
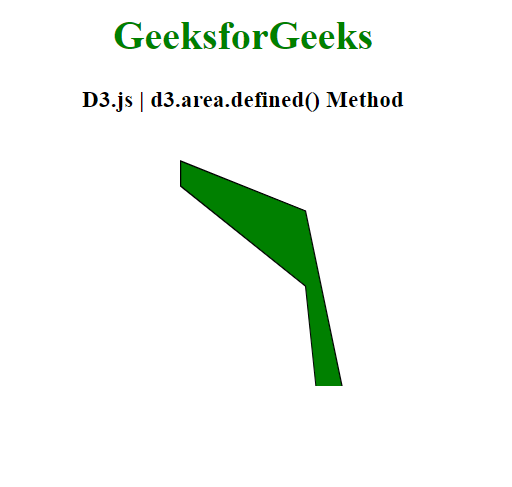
var data = [
{x: 50, y: 10},
{x: 150, y: 30},
{x: 200, y: 150},
{x: 250, y: 10},
{x: 300, y: 150},
{x: 350, y: 50},
{x: 400, y: 190}];
var xScale = d3.scaleLinear()
.domain([0, 8]).range([25, 200]);
var yScale = d3.scaleLinear()
.domain([0,20]).range([200, 25]);
var Gen = d3.area()
.x((p) => p.x)
.y0((p) => p.y*2)
.y1((p) => p.y*4)
// Excluding 3rd index
.defined((d,i) => (i != 3));
d3.select("#gfg")
.append("path")
.attr("d", Gen(data))
.attr("fill", "green")
.attr("stroke", "black");
</script>
</body>
</html>
|
Output:
Example 2:
HTML
<!DOCTYPE html>
<html>
<head>
<meta charset="utf-8">
<script src=
</script>
</head>
<body>
<h1 style="text-align: center; color: green;">
GeeksforGeeks
</h1>
<h3 style="text-align: center;">
D3.js | d3.area.defined() Method
</h3>
<center>
<svg id="gfg" width="250" height="200"></svg>
</center>
<script>
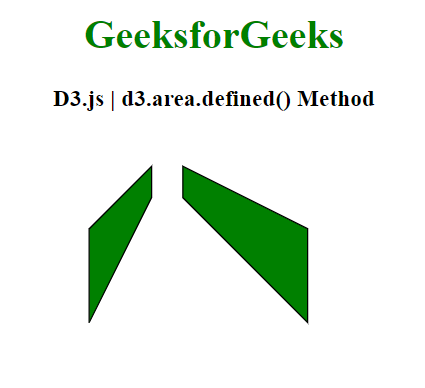
var points = [
{xpoint: 25, ypoint: 150},
{xpoint: 75, ypoint: 50},
{xpoint: 100, ypoint: 150},
{xpoint: 100, ypoint: 50},
{xpoint: 200, ypoint: 150}];
var Gen = d3.area()
.x((p) => p.xpoint)
.y0((p) => p.ypoint/2)
.y1((p) => p.ypoint)
// Excluding 2nd index
.defined((d,i) => (i != 2));
d3.select("#gfg")
.append("path")
.attr("d", Gen(points))
.attr("fill", "green")
.attr("stroke", "black");
</script>
</body>
</html>
|
Output:
Like Article
Suggest improvement
Share your thoughts in the comments
Please Login to comment...