Cutting hierarchical dendrogram into clusters using SciPy in Python
Last Updated :
28 Jul, 2021
In this article, we will see how to cut a hierarchical dendrogram into clusters via a threshold value using SciPy in Python.
A dendrogram is a type of tree diagram showing hierarchical clustering i.e. relationships between similar sets of data. It is used to analyze the hierarchical relationship between the different classes. The scipy.cluster package equips us with tools needed for hierarchical clustering and dendrogram plotting. Thus, has to be imported into the environment.
Let us first create some sample data and plot it normally. We have taken a bunch of random data points as our input, we would be plotting their dendrogram later.
Example: Sample program for creating and visualizing data
Python3
from scipy.cluster import hierarchy
from scipy.cluster.hierarchy import dendrogram
import numpy as np
import matplotlib.pyplot as plt
data = np.array([
[1, 4],
[2, 2],
[3, 7],
[4, 6],
[5, 1],
[6, 3],
[8, 10],
[9, 11]
])
x, y = data.T
plt.scatter(x, y)
plt.show()
|
Output:
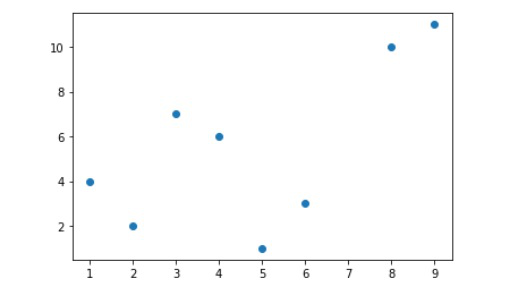
Sample input data points
The dendrogram can be plotted easily using the linkage matrix. A linkage matrix is created via linkage() function. This matrix contains an encoding of the hierarchical clustering to render as a dendrogram.
Syntax:
hierarchy.linkage(y, method=’single’, metric=’euclidean’, optimal_ordering=False):
Parameters:
- y: Input 1D/ 2D array of input vector
- method: methods for calculating the distance between the newly formed cluster and other points. method = ‘single’ , ‘complete’, ‘average’, ‘centroid’
- metric: distance metric to use in the case that input is a collection of observation vectors
- optimal_ordering: If True, the linkage matrix will be reordered so that the distance between successive leaves is minimal
Example: Creating a Dendrogram for our data
Python3
Z = hierarchy.linkage(data, method='average')
plt.figure()
plt.title("Dendrograms")
dendrogram = hierarchy.dendrogram(Z)
|
Output:
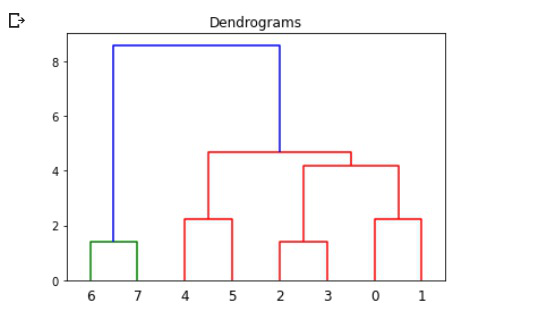
Original Dendrogram without any cut-off
Now, let’s cut the dendrogram by a threshold value. We have chosen a cut-off or threshold value of 4. At this value, a vertical line can also be drawn.
For a chosen cut-off/threshold value, we can always simply count the number of intersections with vertical lines of the dendrogram to get the number of formed clusters. Say we choose a cut-off of max_d = 6, we’d get 2 final clusters.
Example: Cutting dendrogram at the threshold value
Python3
max_d = 4
Z = hierarchy.linkage(data, method='average')
plt.figure()
plt.title("Dendrograms")
dendrogram = hierarchy.dendrogram(Z)
plt.axhline(y=max_d, c='k')
|
Output:
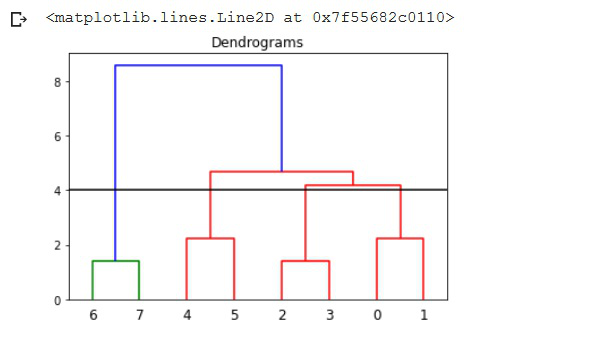
Dendrogram cut at a threshold value of 4
Like Article
Suggest improvement
Share your thoughts in the comments
Please Login to comment...