Create Plot Window of Particular Size in R
Last Updated :
16 May, 2021
In this article, we will discuss various methods available in the R programming language to adjust the plot window size.
Method 1 : Using dev.new() method
The width and height of the plot can be specified along with the units to display the plot in. The usage of this method can be customized to fit the graph well within the plot window size.
Syntax:
dev.new(width, height, unit = c(in, px, cm))
Example 1: Specifying the size in inches
R
xpos <- c(1:10)
ypos <- xpos^2
dev.new(width=20, height=10, unit="in")
plot(xpos,ypos, type="b")
|
Output
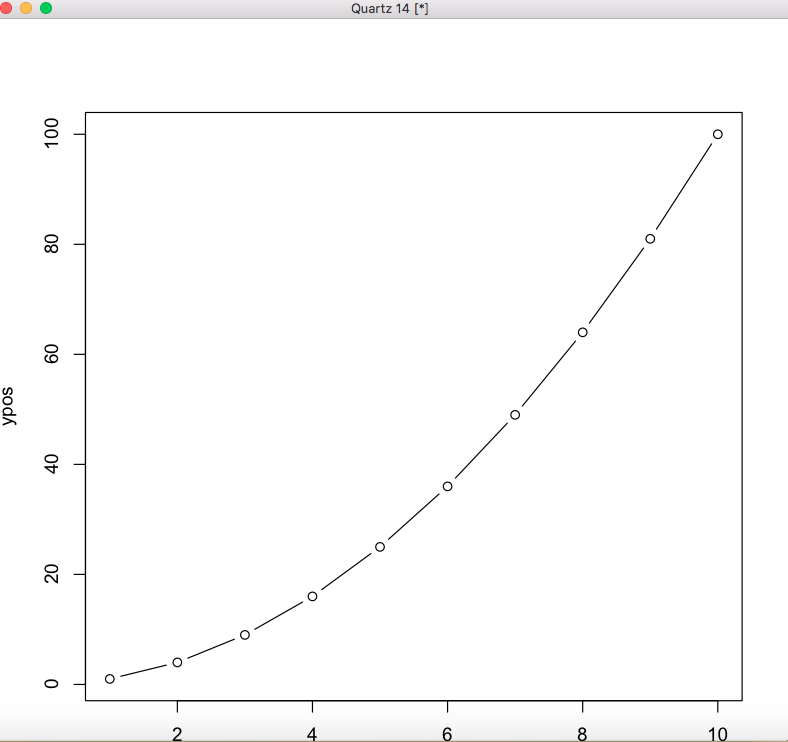
The dimensions of height and width are larger in this case.
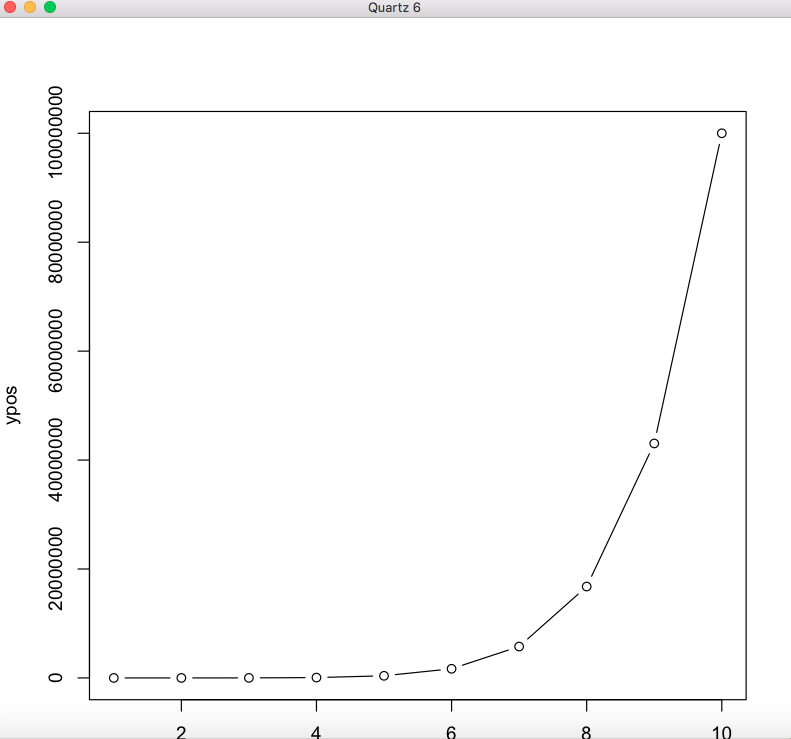
Example 2: Specifying the size in pixels
R
xpos <- c(1:10)
ypos <- xpos^8
dev.new(width=300, height=150, unit="px")
plot(xpos,ypos, type="b")
|
Output
Method 2 : Using windows.options method
windows.options() method is only available in Windows machines. Width and height arguments can be specified to the method to override the default settings and according to these settings are applied till the settings are refreshed using factory.reset().
Syntax:
windows.options(width, height, reset = FALSE)
Example:
R
xpos <- c(1:10)
ypos <- xpos^2
windows.options(width = 20, height = 10, reset = FALSE)
plot(xpos,ypos, type="b")
|
Output
Method 3: Using noRStudioGD option
noRStudioGD = TRUE is an optional parameter in R that can be used to draw plots in earlier versions of R. It can be set in the dev.new() method, in case the method fails to open a device driver.
Syntax:
dev.new(width, height, unit = c(in, px, cm),noRStudioGD = TRUE)
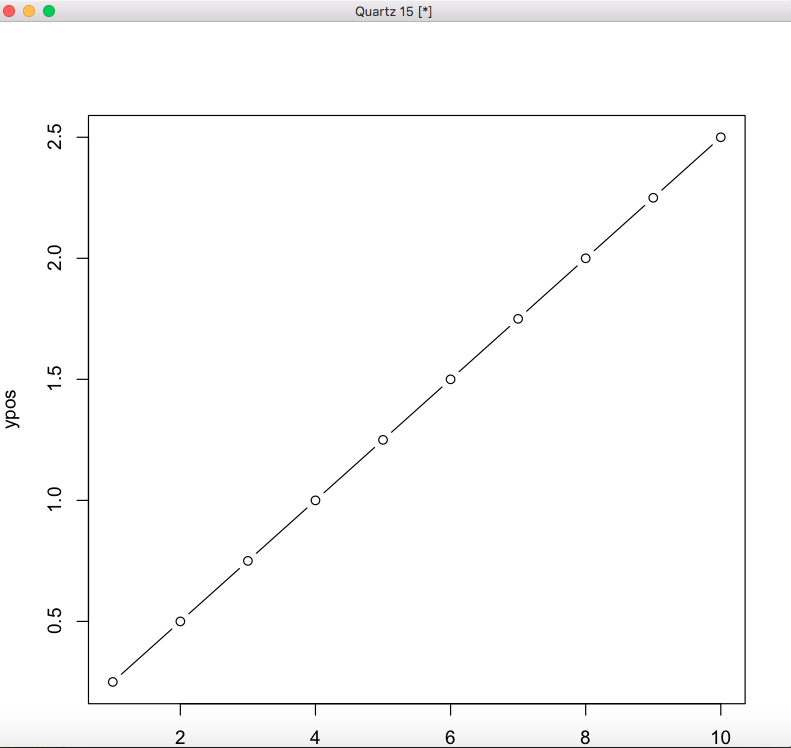
Example:
R
xpos <- c(1:10)
ypos <- xpos^1/4
dev.new(width=50, height=25, unit="cm",noRStudioGD = TRUE)
plot(xpos,ypos, type="b")
|
Output
Like Article
Suggest improvement
Share your thoughts in the comments
Please Login to comment...