Create One Dimensional Scatterplots in R Programming – stripchart() Function
Last Updated :
11 Apr, 2023
Strip Chart is defined as one dimensional scatter plots or dot plots which is used as an alternative to box plot when sample sizes are small. It is created using the stripchart() function in R Language.
R – stripchart Function
Syntax: stripchart(x, data = NULL method, jitter )
Parameters:
- x : value of data from which the plots are to be produced.
- data : a data.frame from which the variables in x value should be taken.
- Method : the method is basically used to separate coincident points.
- jitter : when method = “jitter” is used, jitter will produce the amount of jittering applied.
Stripchart Function in R Programming Language
This example makes use of ToothGrowth database, stripchart() Function is implemented using ToothGrowth database.
Dataset:
R
ToothGrowth$dose <- as.factor(ToothGrowth$dose)
head(ToothGrowth, 7)
|
Output:
   len supp dose
1  4.2   VC  0.5
2 11.5   VC  0.5
3  7.3   VC  0.5
4  5.8   VC  0.5
5  6.4   VC  0.5
6 10.0   VC  0.5
7 11.2   VC  0.5
The above code will print data set
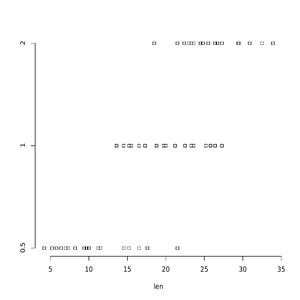
Example 1: Simple Stripchart in R Programming
R
stripchart(len ~ dose, data = ToothGrowth,
pch = 22, frame = FALSE)
|
Output:
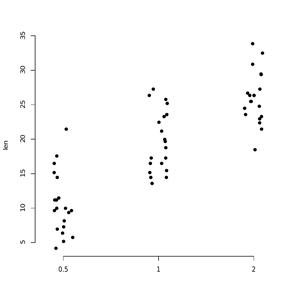
Example 2: Plot vertical stripchart in R Programming Language
R
stripchart(len ~ dose, data = ToothGrowth,
pch = 16, frame = FALSE, vertical = TRUE,
method = "jitter")
|
Output:
Example 3: Change in point shapes (pch) and colors by groups
R
stripchart(len ~ dose, data = ToothGrowth,
frame = FALSE, vertical = TRUE,
method = "jitter", pch = c(16, 19, 18),
col = c("blue ", "darkgreen", "orange"),
main = "Length / dose", xlab = "Dose",
ylab = "Length")
|
Output:
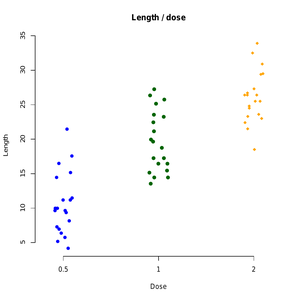
The above example will add the main title and axis labels and print colored stripcharts.
Example 4: Strip Chart for Multiple Numeric Vectors
In this example, we will use an iris dataset and list that contains the variables and plot stripchart plot.
R
x <- list('Petal Length' = iris$Petal.Length,
'Petal Width' = iris$Petal.Width)
stripchart(x,
main = 'Petal Width & Petal Distributions',
col = c('Green', 'coral2'),
method = 'jitter')
|
Output:

Example : the stripchart() function can be used to create a one-dimensional scatterplot.
R
data <- c(10, 15, 20, 22, 25, 30, 32, 35, 40)
stripchart(data, method = "jitter", pch = 20, col = "blue", main = "One-Dimensional Scatterplot")
|
output :
Like Article
Suggest improvement
Share your thoughts in the comments
Please Login to comment...