Create multiple barplots in R side by side
Last Updated :
30 May, 2021
In R programming language, barplot is a graphical representation of linear data which is one-dimensional. Bar plot is used for statistical analysis for easy understanding of the data. It represents the given data in the form of bars. It can give bar graphs along x-axis and y-axis. Where x-axis represents the name of the data and y-axis represents the bar graph values from 0 to n range.
In this article, we are going to create multiple bar plots side by side in R Programming. If we want to create multiple bar plots side by side then we have to specify the parameter in the above syntax i.e. beside=T. It will specify True. This will place the second, third, ., so on to the next of the bar plots
Syntax:
barplot(data,beside=T)
Where, beside is to place bar plots side by side
Hence, to draw multiple barplots side by side the data for each barplot is initialized and combined using cbind(). Then it is actually plotted using barplot() with beside set to TRUE(T).
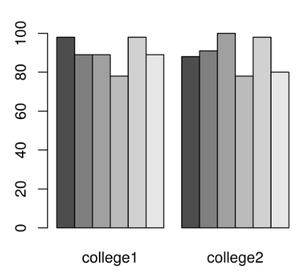
Example 1:
R
college1=c(98,89,89.0,78,98,89)
college2=c(88,91,100,78,98,80)
college_data=cbind(college1,college2)
barplot(college_data,beside=T)
|
Output:
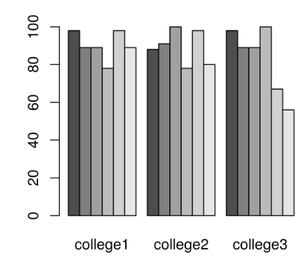
Example 2:
R
college1=c(98,89,89.0,78,98,89)
college2=c(88,91,100,78,98,80)
college3=c(98,89,89.0,100,67,56)
college_data=cbind(college1,college2,college3)
barplot(college_data,beside=T)
|
Output:
Like Article
Suggest improvement
Share your thoughts in the comments
Please Login to comment...