An interactive and Informative dashboard is very necessary for better understanding our data sets. This will help a researcher for getting a better understanding of our results and after that, a researcher can make some necessary changes for better understanding. Visual Reports is must better than in Number format for quick understanding.
In simple words, Streamlit is a very simple and easy way to create a dashboard that helps us to make an efficient, effective, and explanatory dashboard. Streamlit is an open-source web application framework which makes the work simple for information researcher by investigating and understanding information by means of a lovely dashboard.
No front-end knowledge is required for working with Streamlit. This framework will convert data scripts into a shareable web application in few lines of codes and just in a few seconds as well. In this article, we are going to discuss how to create an interactive dashboard in Python using Streamlit.
Installation:
Before doing the practical implementation, we need to install Streamlit web framework. Just Run this below command on the command prompt.
pip install streamlit
Once we successfully installed streamlit. Now, let check before go further, Let’s check whether streamlit is successfully installed or not. Just write this below command,
streamlit --version

For verification of installation of Streamlit web Framework
We are done with our basic installation step. Now, Let’s run our first program by using this predefined command,
streamlit hello
Once we run this command for first this will ask us for access, Just Click on Allow Access Button.

Once we clicked on Allow Access button, we will get a Local URL on our command prompt. This will ask us for our email id, we can skip this step and just press enter, Otherwise, we can enter our email id for future technical support.

Output:
This window will automatically open on our Chrome web browser.

We can choose any demo for getting more understanding about streamlit web framework. For Closing or Quit our running application, we need to press Ctrl+C.
Approach:
Let’s discuss our approach, we will create an interactive and explanatory dashboard using the Stroke Prediction Dataset. There are many ways available for displaying text, images, maps, and many more. Streamlit gives us some function through which we can write titles, headers, markdown, etc.
| Function |
Description
|
| title() |
It is used to set the title. |
| markdown() |
It is used to display some text as Markdown. |
| text() |
This function is used to write some description text for any topic or images. |
| latex() |
Used for mathematical expressions on the explanatory dashboard. |
| sidebar() |
This function is used to create a sidebar on the dashboard then we can put some data on that part. |
| map() |
Used to display a map. |
The above functions are commonly used. In this example, We can create three types of charts named Line Chart, Bar Chart, and Bubble Chart. Here, we have four conditions as well ‘Formerly_Smoked’, ‘Smoked’, ‘Never_Smoked’, and ‘Unknown’. With the help of this example, We can create any chart diagram for any conditions means a total of 12 chart diagrams.
Step 1: First, We are going to set a title and some description for the main dashboard window using the above functions:
st.title(“Stroke Prediction Dashboard”)
st.markdown(“The dashboard will help a researcher to get to know more about the given datasets and it’s output”)
Step 2: Now, Let’s create a sidebar with a simple title and description.
st.sidebar.title(“Select Visual Charts”)
st.sidebar.markdown(“Select the Charts/Plots accordingly:”)
Step 3: Using pandas Library, we need to read our .csv file for creating a data frame. You can use this dataset for demonstration.
data = pd.read_csv("<Path_for_.csv_file>")
Step 4: Streamlit also provides us some functions through which we can easily create a select box within a single line of code. In our program, we are giving two arguments first as title or Captions and second for select box options in form of a tuple.
chart_visual = st.sidebar.selectbox(‘Select Charts/Plot type’, (‘Line Chart’, ‘Bar Chart’, ‘Bubble Chart’))
Step 5: As similar to the select box, we have another method for creating a checkbox.
st.sidebar.checkbox("Show Analysis by Smoking Status", True, key=1)
Step 6: Using selectbox() function, we are going to create a selectbox with four options.
selected_status = st.sidebar.selectbox(‘Select Smoking Status’, options=[‘Formerly_Smoked’, ‘Smoked’, ‘Never_Smoked’, ‘Unknown’])
Step 7: When we select one option from the first selection box that value gets stored into the chart_visual variable. This variable value represents the chart type. Through the second selection box, that value gets stored into the selected_status variable. Using this value, we will create the main graph. Using the simple if_else condition, we will make conditions for drawing the graphs.
Step 8: Using the add_trace() method, New traces will be added to a graph object figure. This method will take a graph object trace (an instance of go.Bar, go.Scatter etc.) as an argument and adds it to the figure.
Step 9: Using go.Scatter(), go.Bar() method, We will create informative graphs through which a researcher can easily understand the output of the datasets. First, go.Scatter() takes four arguments in our program, first as x_axis value, second as y-axis value, third as a mode of the figure, and fourth as the name of the newly created graph.
fig.add_trace(go.Scatter(x=data.Country, y=data.formerly_smoked,
                                 mode='lines',
                                 name='Formerly_Smoked'))
Step 10: Second, go.Bar() method takes three arguments in our program, first as x_axis value, second as y-axis value, and third as the name of the newly created graph.
fig.add_trace(go.Bar(x=data.Country, y=data.Unknown,
                             name="Unknown"))
Below is the implementation:
Python3
import streamlit as st
import pandas as pd
import plotly.graph_objects as go
st.title("Stroke Prediction Dashboard")
st.markdown("The dashboard will help a researcher to get to know \
more about the given datasets and it's output")
st.sidebar.title("Select Visual Charts")
st.sidebar.markdown("Select the Charts/Plots accordingly:")
data = pd.read_csv("D:\PyCharm_Projects\Streamlit\demo_data_set.csv")
chart_visual = st.sidebar.selectbox('Select Charts/Plot type',
('Line Chart', 'Bar Chart', 'Bubble Chart'))
st.sidebar.checkbox("Show Analysis by Smoking Status", True, key = 1)
selected_status = st.sidebar.selectbox('Select Smoking Status',
options = ['Formerly_Smoked',
'Smoked', 'Never_Smoked',
'Unknown'])
fig = go.Figure()
if chart_visual == 'Line Chart':
if selected_status == 'Formerly_Smoked':
fig.add_trace(go.Scatter(x = data.Country, y = data.formerly_smoked,
mode = 'lines',
name = 'Formerly_Smoked'))
if selected_status == 'Smoked':
fig.add_trace(go.Scatter(x = data.Country, y = data.Smokes,
mode = 'lines', name = 'Smoked'))
if selected_status == 'Never_Smoked':
fig.add_trace(go.Scatter(x = data.Country, y = data.Never_Smoked,
mode = 'lines',
name = 'Never_Smoked'))
if selected_status == 'Unknown':
fig.add_trace(go.Scatter(x=data.Country, y=data.Unknown,
mode='lines',
name="Unknown"))
elif chart_visual == 'Bar Chart':
if selected_status == 'Formerly_Smoked':
fig.add_trace(go.Bar(x=data.Country, y=data.formerly_smoked,
name='Formerly_Smoked'))
if selected_status == 'Smoked':
fig.add_trace(go.Bar(x=data.Country, y=data.Smokes,
name='Smoked'))
if selected_status == 'Never_Smoked':
fig.add_trace(go.Bar(x=data.Country, y=data.Never_Smoked,
name='Never_Smoked'))
if selected_status == 'Unknown':
fig.add_trace(go.Bar(x=data.Country, y=data.Unknown,
name="Unknown"))
elif chart_visual == 'Bubble Chart':
if selected_status == 'Formerly_Smoked':
fig.add_trace(go.Scatter(x=data.Country,
y=data.formerly_smoked,
mode='markers',
marker_size=[40, 60, 80, 60, 40, 50],
name='Formerly_Smoked'))
if selected_status == 'Smoked':
fig.add_trace(go.Scatter(x=data.Country, y=data.Smokes,
mode='markers',
marker_size=[40, 60, 80, 60, 40, 50],
name='Smoked'))
if selected_status == 'Never_Smoked':
fig.add_trace(go.Scatter(x=data.Country,
y=data.Never_Smoked,
mode='markers',
marker_size=[40, 60, 80, 60, 40, 50],
name = 'Never_Smoked'))
if selected_status == 'Unknown':
fig.add_trace(go.Scatter(x=data.Country,
y=data.Unknown,
mode='markers',
marker_size=[40, 60, 80, 60, 40, 50],
name="Unknown"))
st.plotly_chart(fig, use_container_width=True)
|
For Running this above program, We will run one simple command on our command prompt.
streamlit run file_name.py
Output:
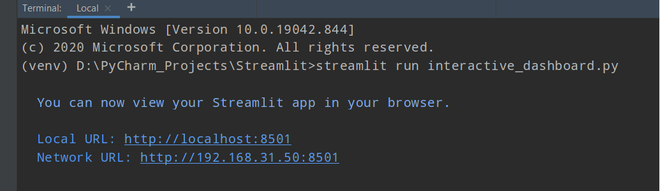
Command Prompt Window Output
With the help of localhost URL, We can see our program output on any web browser.

Main Dashboard Output
Output video:
Like Article
Suggest improvement
Share your thoughts in the comments
Please Login to comment...