Create Heatmaps using graph_objects class in Plotly
Last Updated :
05 Sep, 2020
A Plotly is a Python library that is used to design graphs, especially interactive graphs. It can plot various graphs and charts like histogram, barplot, boxplot, spreadplot, and many more. It is mainly used in data analysis as well as financial analysis. plotly is an interactive visualization library.
Heatmaps using graph_objects
A heatmap is a two-dimensional graphical representation of data where the individual values that are contained in a matrix are represented as colors.
Syntax: plotly.graph_objects.Heatmap(arg=None, autocolorscale=None, colorbar=None, colorscale=None, x=None, y=None, z=None, **kwargs)
Parameters:
arg: dict of properties compatible with this constructor
autocolorscale: Determines whether the colorscale is a default palette (autocolorscale: true) or the palette determined by colorscale.
colorbar: plotly.graph_objects.heatmap.ColorBar instance or dict with compatible properties
colorscale: Sets the colorscale. The colorscale must be an array containing arrays mapping a normalized value to an rgb, rgba, hex, hsl, hsv, or named color string.
x: Sets the x coordinates.
y: Sets the y coordinates.
z: Sets the z coordinates.
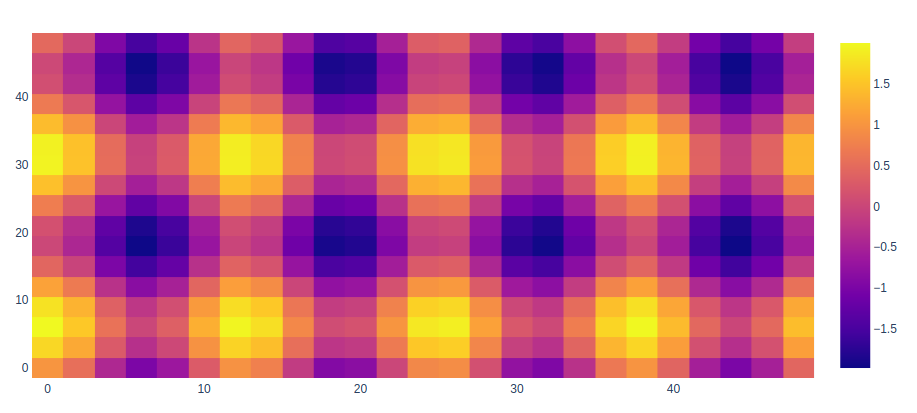
Example:
Python3
import plotly.graph_objects as go
feature_x = np.arange(0, 50, 2)
feature_y = np.arange(0, 50, 3)
[X, Y] = np.meshgrid(feature_x, feature_y)
Z = np.cos(X / 2) + np.sin(Y / 4)
fig = go.Figure(data =
go.Heatmap(x = feature_x, y = feature_y, z = Z,))
fig.show()
|
Output:
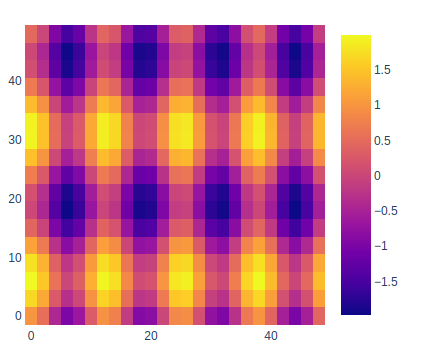
Presenting Heat map with Unequal Block Sizes
In plotly, it is possible to show the unequal sizes of the blocks as to make the data differentiate between each other to make it more clear while presenting as the data has different height and width compared to each other.
Example:
Python3
import plotly.graph_objects as go
feature_x = np.arange(0, 50, 2)
feature_y = np.arange(0, 50, 3)
[X, Y] = np.meshgrid(feature_x, feature_y)
Z = np.cos(X / 2) + np.sin(Y / 4)
fig = go.Figure(data=go.Heatmap(
x=feature_x, y=feature_y, z=Z,))
fig.update_layout(
margin=dict(t=200, r=200, b=200, l=200),
showlegend=False,
width=700, height=700,
autosize=False)
fig.show()
|
Output:
Like Article
Suggest improvement
Share your thoughts in the comments
Please Login to comment...