Create Boxplot of Multiple Column Values using ggplot2 in R
Last Updated :
28 Nov, 2021
In this article, we will discuss how to create a boxplot of multiple column values using ggplot2 in R Programming Language.
A dataframe can be created by containing values organized in the form of rows and columns. The values may belong to different data types. The reshape2 package is used to aggregate data by using the functions, melt and cast. The library can be installed and loaded into the working space using the following command :
install.packages("reshape2")
The melt method in R is used to melt an R object, say a dataframe into a form suitable for easy casting.
Syntax:
melt(data, id.vars, measure.vars)
Parameters:
- data – The data set to melt
- id.vars – Id variables.
- measure.vars – Measured variables.
The ggplot method in this package is used to declare and define a ggplot object. It takes as input a dataframe and defines a set of aesthetic mappings to be intended for the plot.
ggplot(data = NULL, mapping = aes())
Parameters:
- data – The dataframe to be used as input in the ggplot method
- mapping – Default list of aesthetic mappings to use for plot.
- Additional components can be added to the ggplot object. The geom_boxplot() method is used to draw a boxplot() in R.
Syntax:
geom_boxplot( mapping = aes(x , y , color ))
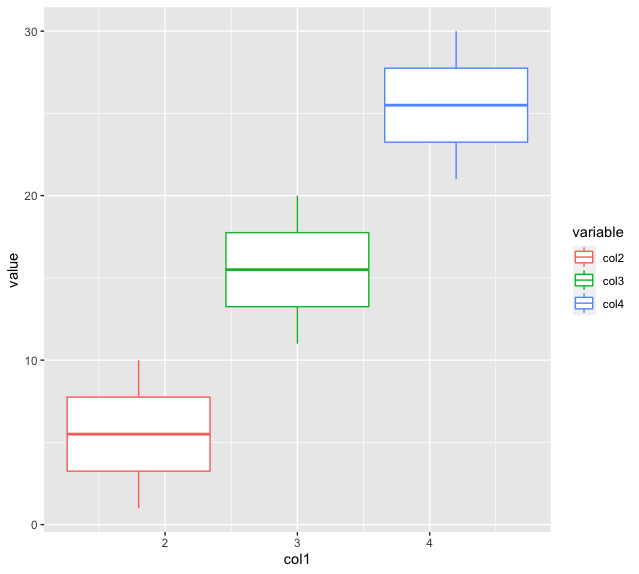
Example:
R
library(reshape2)
library(ggplot2)
data_frame < - data.frame(col1=rep(1: 5, each=2),
col2=1: 10,
col3=11: 20,
col4=21: 30)
data_mod < - melt(data_frame, id.vars='col1',
measure.vars=c('col2', 'col3', 'col4'))
p < - ggplot(data_mod) +
geom_boxplot(aes(x=col1, y=value, color=variable))
print(p)
|
Output
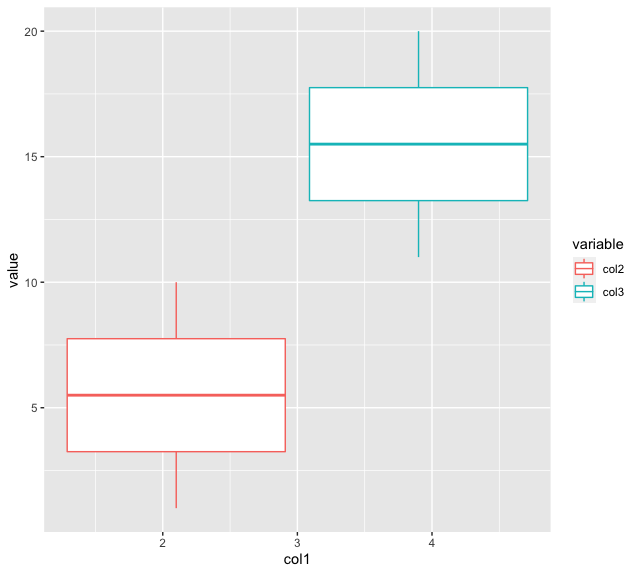
Example 2:
The following code snippet illustrates the plotting the values belonging to col2 and col3 on the x axis and its corresponding data items on the y axes :
R
library(reshape2)
library(ggplot2)
data_frame < - data.frame(col1=rep(1: 5, each=2),
col2=1: 10,
col3=11: 20,
col4=21: 30)
data_mod < - melt(data_frame, id.vars='col1',
measure.vars=c('col2', 'col3'))
p < - ggplot(data_mod) +
geom_boxplot(aes(x=col1, y=value, color=variable))
print(p)
|
Output:
Like Article
Suggest improvement
Share your thoughts in the comments
Please Login to comment...