Create a Plot Matrix of Scatterplots in R Programming – pairs() Function
Last Updated :
10 Dec, 2021
pairs() function in R language is used to return a plot matrix, consisting of scatter plots corresponding to each data frame.
R – Create Plot Matrix of Scatterplots
Syntax: pairs(data)
Parameters:
- data: It is defined as value of pairs Plot.
Returns: Color, Labels, Panels, and by Group in pairs plot.
Create Plot Matrix of Scatterplots in R
Example 1: Basic example of R – pairs() Function
R
set.seed(425340)
N <- 800
x1 <- rnorm(N)
x2 <- x1 + rnorm(N, 0, 4)
x3 <- 2 * x1 - x2 + rnorm(N, 0, 3)
data <- data.frame(x1, x2, x3)
pairs(data)
|
Output:
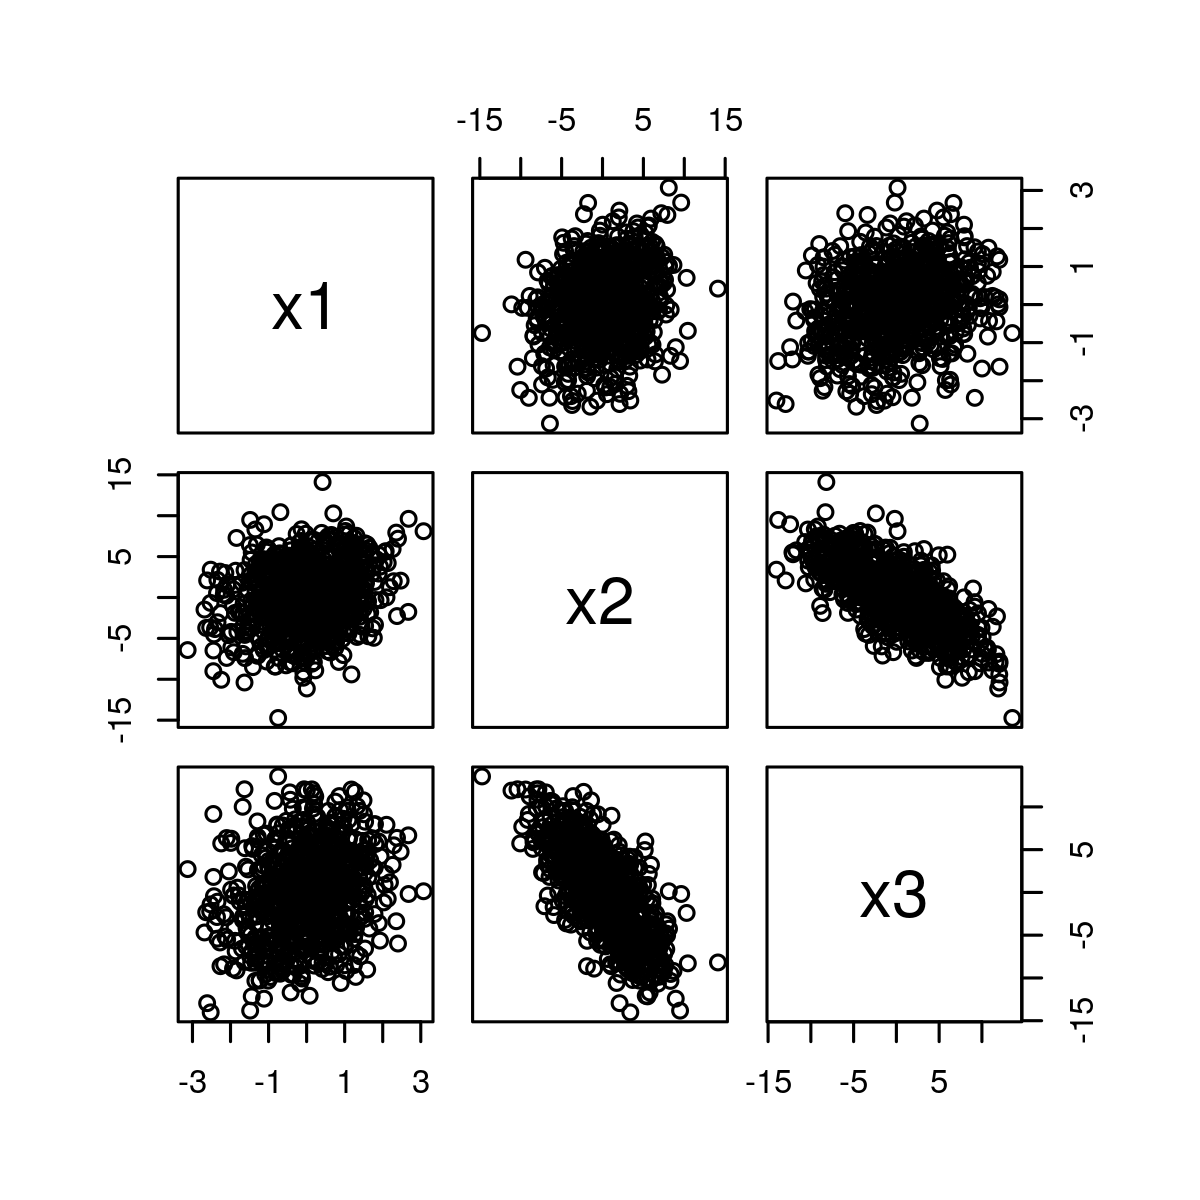
Here, in the above example, the diagonal shows the names of the three numeric variables. The middle graphic in the first-row shows the relation between x1 and x2 whereas the right graph in the first row shows the relation between x1 and x3 and so on.
Example 2: Another example to select Variables of pairs Plot
R
set.seed(425340)
N <- 800
x1 <- rnorm(N)
x2 <- x1 + rnorm(N, 0, 4)
x3 <- 2 * x1 - x2 + rnorm(N, 0, 3)
data <- data.frame(x1, x2, x3)
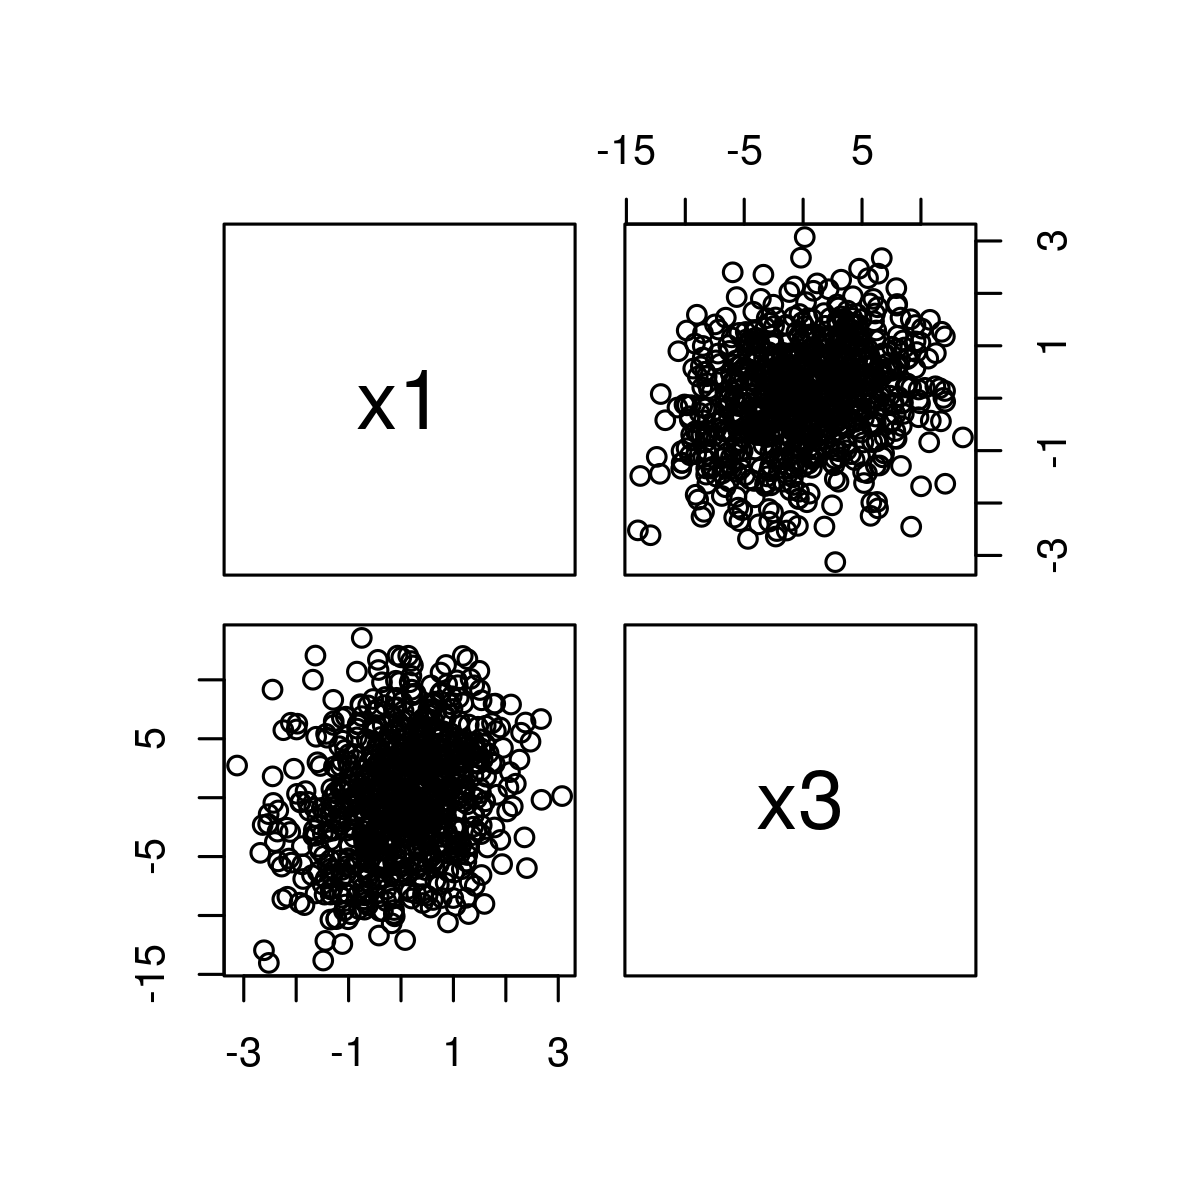
pairs(~ x1 + x3, data = data)
|
Output:
Example 3: Another example with implementation to Modify Color, Shape of Points, Labels and Title
R
set.seed(425340)
N <- 800
x1 <- rnorm(N)
x2 <- x1 + rnorm(N, 0, 4)
x3 <- 2 * x1 - x2 + rnorm(N, 0, 3)
data <- data.frame(x1, x2, x3)
pairs(~ x1 + x2 + x3, data = data)
pairs(~ x1 + x3, data = data)
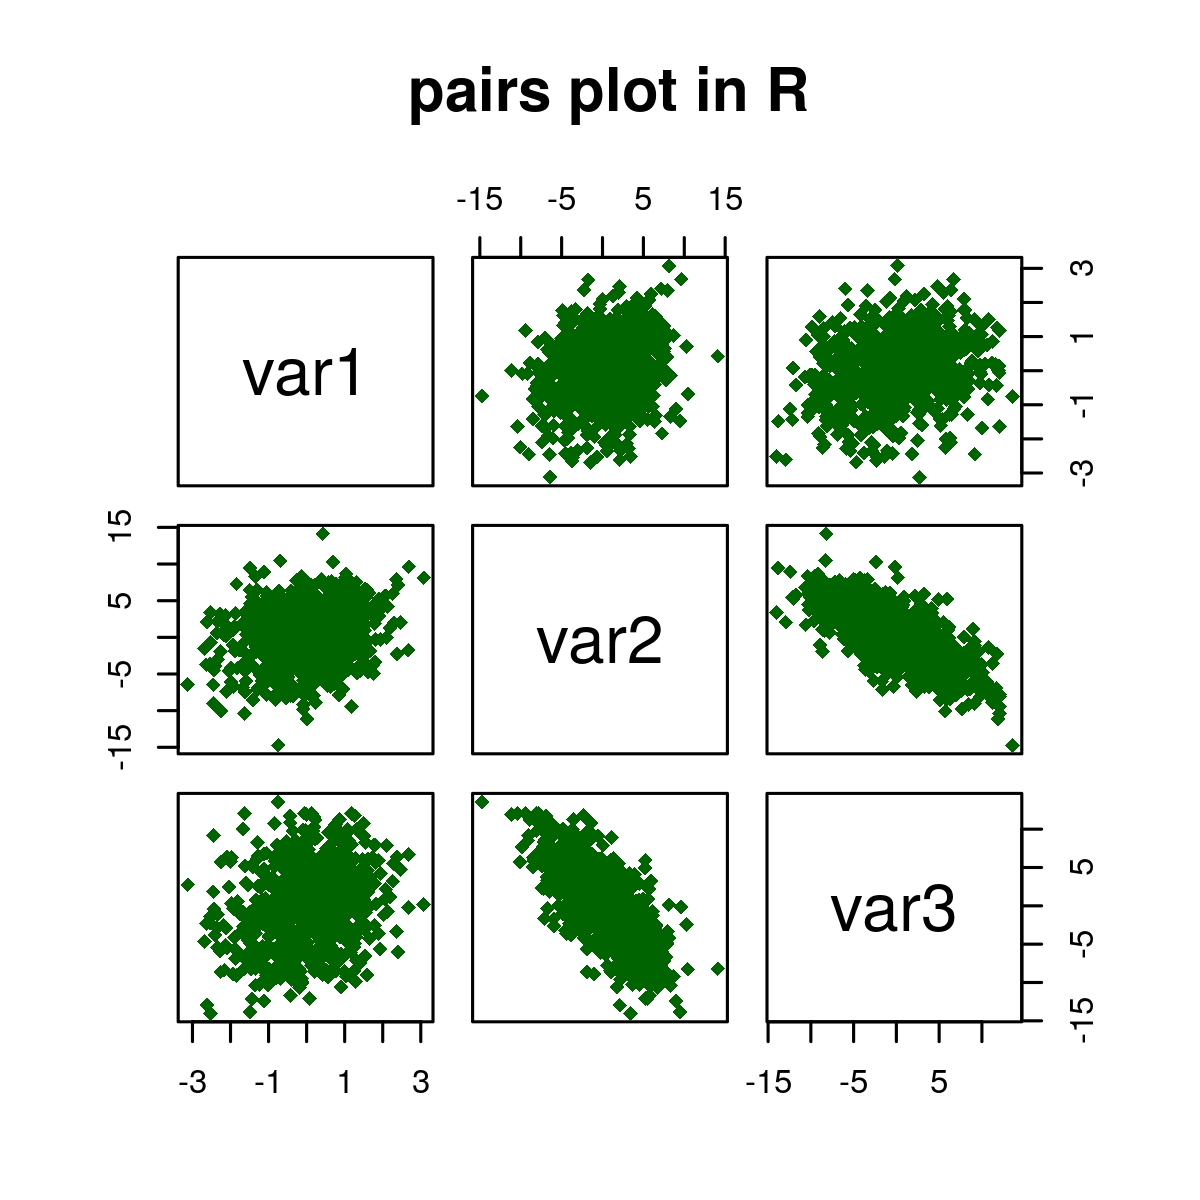
pairs(data[, 1:3],
col = "darkgreen",
pch = 18,
labels = c("var1", "var2", "var3"),
main = " pairs plot in R")
|
Output:
Like Article
Suggest improvement
Share your thoughts in the comments
Please Login to comment...