Create a Line Chart using Recharts in ReactJS
Last Updated :
04 Dec, 2023
This article focuses on creating Line Charts, vital for displaying trends over time. Leveraging Recharts within the React framework, you’ll seamlessly integrate sophisticated charts, elevating user experience and uncovering valuable data insights.
Prerequisites:
Creating React Application And Installing Module:
Step 1: Create a React application using the following command.
npx create-react-app foldername
Step 2: After creating your project folder i.e. foldername, move to it using the following command.
cd foldername
Step 3: After creating the ReactJS application, Install the required modules using the following command.
npm install --save recharts
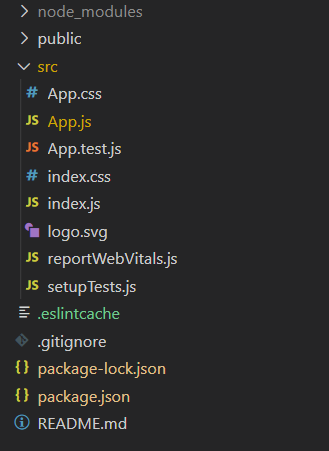
Project Structure:

Project Structure
The updated dependencies in package.json file will look like:
"dependencies": {
    "react": "^18.2.0",
    "recharts": "^2.10.1",
    "react-dom": "^18.2.0",
    "react-scripts": "5.0.1",
    "web-vitals": "^2.1.4",
}
Example: Now write down the following code in the App.js file.
Javascript
import "./App.css";
import {
LineChart,
ResponsiveContainer,
Legend,
Tooltip,
Line,
XAxis,
YAxis,
CartesianGrid,
} from "recharts";
const pdata = [
{
name: "MongoDb",
student: 11,
fees: 120,
},
{
name: "Javascript",
student: 15,
fees: 12,
},
{
name: "PHP",
student: 5,
fees: 10,
},
{
name: "Java",
student: 10,
fees: 5,
},
{
name: "C#",
student: 9,
fees: 4,
},
{
name: "C++",
student: 10,
fees: 8,
},
];
function App() {
return (
<>
<h1 className="text-heading">Line Chart Using Rechart</h1>
<ResponsiveContainer width="100%" aspect={3}>
<LineChart data={pdata} margin={{ right: 300 }}>
<CartesianGrid />
<XAxis dataKey="name" interval={"preserveStartEnd"} />
<YAxis></YAxis>
<Legend />
<Tooltip />
<Line
dataKey="student"
stroke="black"
activeDot={{ r: 8 }}
/>
<Line dataKey="fees" stroke="red" activeDot={{ r: 8 }} />
</LineChart>
</ResponsiveContainer>
</>
);
}
export default App;
|
Step to Run Application: Run the application using the following command from the root directory of the project:
npm start
Output: Now open your browser and go to http://localhost:3000:

Like Article
Suggest improvement
Share your thoughts in the comments
Please Login to comment...