Create a Cycle Graph using Networkx in Python
Last Updated :
03 Jan, 2021
A cycle graph is a graph which contains a single cycle in which all nodes are structurally equivalent therefore starting and ending nodes cannot be identified.
Properties:
- Number of nodes in a Cycle Graph(Cn) are equal to N.
- Number of edges in a Cycle Graph(Cn) are equal to N.
- Every node is connected to 2 edges hence degree of each node is 2.
- It is a Hamiltonian Graph.
- It is a Connected Graph.
- Even after removal of one edge it remains connected as it is cyclic.
- We can simply obtain cycle graph by joining the initial an final node of a path graph.
Module Used:
We will use the networkx module for realizing a Cycle graph. This module in python is used for visualizing and analyzing different kind of graphs for most of which the generators are predefined in this library.
It comes with an inbuilt function networkx.cycle_graph() and can be illustrated using the networkx.draw() method.
Functions used:
- draw()-This function is used to draw the required graph using networkx module.
Syntax:
networkx.draw(G, node_size, node_color)
Parameters:
- G: It refers to the Cycle graph object it is passed so that draw method knows exactly which graph is to be printed.
- node_size: It refers to the size of nodes.
- node_color: It refers to color of the nodes.
- cycle_graph()- This function is used to create a cycle graph, it gives all the required information for creating one.
Syntax:
networkx.cycle_graph(n)
Parameters:
n: This parameter is used to specify the number of nodes in the cycle graph.
Returns:
This method returns Cn (Cycle graph with n nodes). Therefore it is used to initialize the graph object G.
Approach:
- Import module
- Create cycle graph object using cycle_graph() constructor
- Use nx.draw() function
- Display plot
Program:
Python3
import networkx
G = networkx.cycle_graph(8)
networkx.draw(G, node_size=150, node_color='green')
|
OUTPUT:
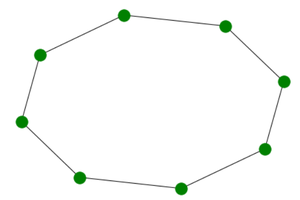
Output
Like Article
Suggest improvement
Share your thoughts in the comments
Please Login to comment...