Create a correlation matrix from a DataFrame of same data type in R
Last Updated :
17 Apr, 2021
A correlation matrix is a type of table showing correlation coefficients between variables. Here, each cell in the table shows the correlation between two variables. This matrix is used correlation matrix is used to summarize data. In this article we, will be looking at the approach to get the correlation matrix from a given DataFrame of the same data type in R Programming language.
cor() method can be used for creating a correlation matrix from the given DataFrame of the same data type using the R language. This is one of the easiest methods to create the correlation matrix from the dataframe as here the user just need to call the cor() function with the name of the dataframe as its parameter and further the cor() function with the specified parameter will be returning to the user the correlation matrix of the given data-frame with the same data frame.
Syntax: cor(x,use = “everything”,method = c(“pearson”, “kendall”, “spearman”))
Parameter:
- x:-a numeric vector, matrix, or data frame.
- use:-an optional character string giving a method for computing covariance in the presence of missing values.
- method:-a character string indicating which correlation coefficient is to be computed.
Returns:
It will return the correlation matrix.
Example 1:
R
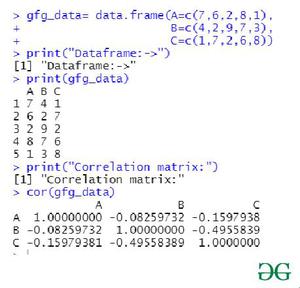
gfg_data= data.frame(A=c(7,6,2,8,1),
B=c(4,2,9,7,3),
C=c(1,7,2,6,8))
print("Dataframe:->")
print(gfg_data)
print("Correlation matrix:")
cor(gfg_data)
|
Output:
Example 2:
R
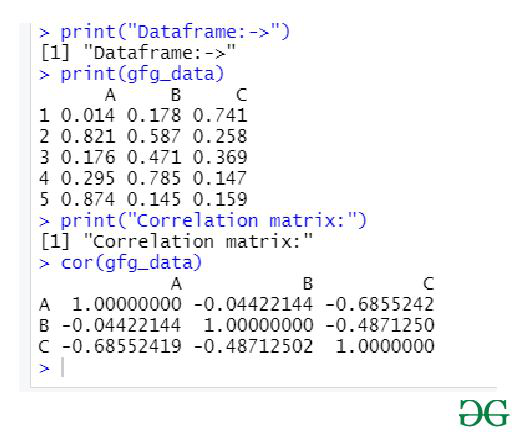
gfg_data= data.frame(A=c(.014,0.821,0.176,0.295,0.874),
B=c(0.178,0.587,0.471,0.785,0.145),
C=c(0.741,0.258,0.369,0.147,0.159))
print("Dataframe:->")
print(gfg_data)
print("Correlation matrix:")
cor(gfg_data)
|
Output:
Like Article
Suggest improvement
Share your thoughts in the comments
Please Login to comment...